In section 5.3, the structure of eastward crossing mode are discussed for the case that the computational domain exists on the north of the inertially unstable region. It is shown, there, that crossing modes have large amplitudes near the north boundary. Also in other cases, crossing modes have same characteristics: crossing modes have large amplitudes near the north (south) boundary when the computational domain exists on the north (south) of the inertially unstable region. This characteristics does not change regardless the value of E. When the value of E is small and dispersion curves of crossing modes does not intersect dispersion curves of other gravity modes, the above-mentioned results does not change.
In the followings, the structures of crossing modes for various cases are shown.
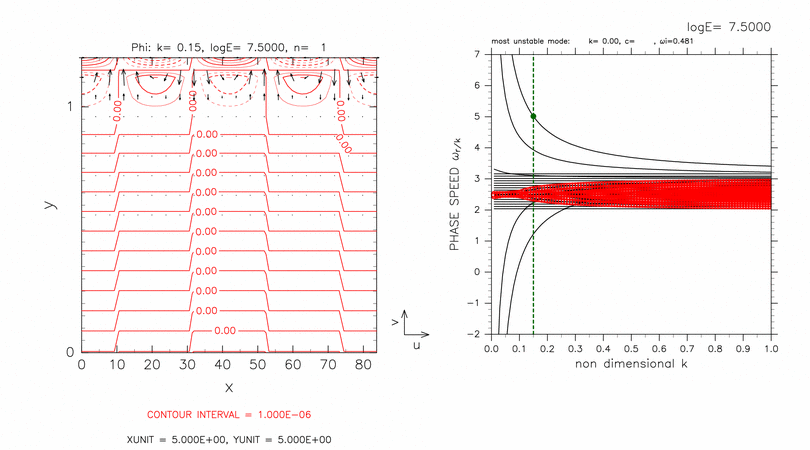
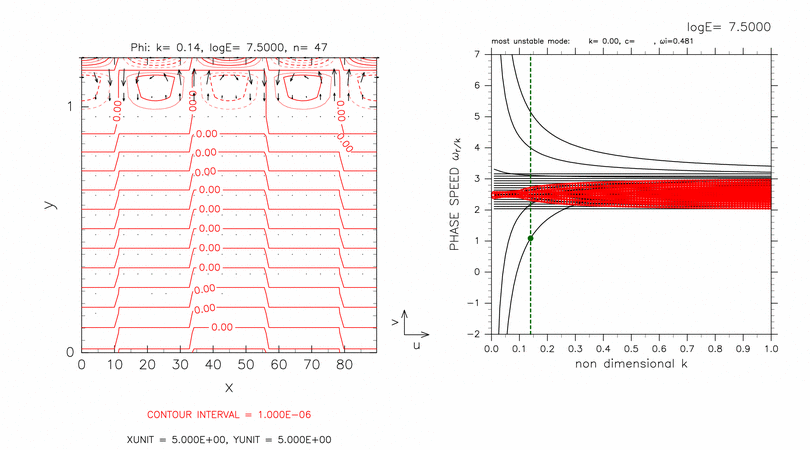
Figures D-1 and D-2 show the result of a case with a computational domain 0.0 < y < 1.2 for log E=7.50. In this case, there exist two grid points on the north of the inertially unstable region. Only dispersion curves of crossing modes remain in outside of dispersion curves of continuous modes in figures D-1 and D-2. Phase speed of other neutral modes are almost c=2.5 (basic velocity at dynamic equator) for log E=7.50 as discussed by Clark and Haynes, 1996.
Figure D-1 shows the structure of an eastward crossing mode which is described in section 5.3. Westward crossing mode (figure D-2) also has large amplitude near the north boundary.
|
|
| [Animation] | [Animation] |
|
Figure D-1: Same as figure 8, horizontal structure (left) and dispersion curves (right) of eastward crossing mode for log E=7.50, k=0.15. Contour intervals (left) are 1.0 × 10⁻⁶. Click [Animation] to show dispersion curves for various values of k around c=5.00. The position of crossing modes are indicated by a green filled circle in the right panel of the animation. Contour intervals of the animation are 1.0 × 10⁻⁶ for k=0.15 and 5.0 × 10⁻⁶ for k=0.07, respectively. |
Figure D-2: Same as figure D-1, but for westward crossing mode at k=0.14. Contour intervals (left) are 1.0 × 10⁻⁶. Click [Animation] to show dispersion curves for various values of k around c=1.00. Contour intervals of the animation are 3.0 × 10⁻⁶ for k=0.06 and 1.0 × 10⁻⁶ for k=0.14, respectively. |
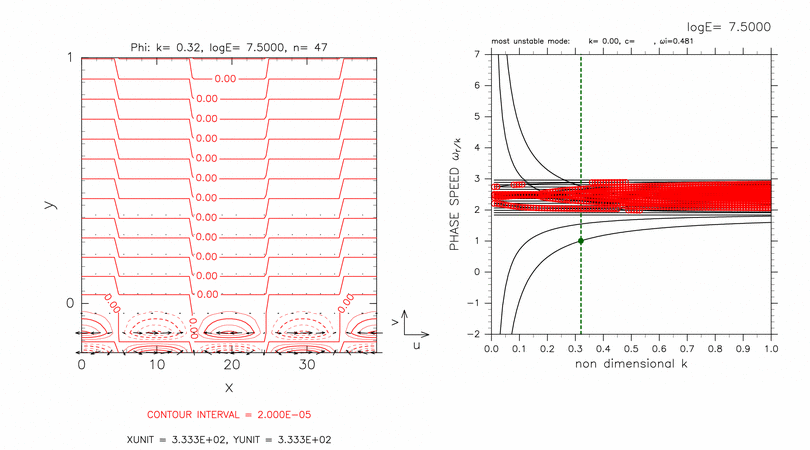
Figures D-3 and D-4 show the result of a case with a computational domain -0.2 < y < 1.0 for log E=7.50. In this case, there exist two grid points on the south of the inertially unstable region. Only dispersion curves of crossing modes remain in outside of dispersion curves of continuous modes in figures D-3 and D-4. Phase speed of other neutral modes are almost c=2.5 (basic velocity at the dynamic equator) for log E=7.50 as discussed by Clark and Haynes, 1996.
Both eastward crossing mode (figure D-3) and westward crossing mode (figure D-4) have large amplitude near the south boundary.

|
|
| [Animation] | [Animation] |
|
Figure D-3: Same as figure D-1, but for eastward crossing mode for k=0.09 obtained with domain of -0.2 < y < 1.0. Contour intervals (left) are 1.0 × 10⁻⁵. Click [Animation] to show dispersion curves for various values of k around c=5.00. Contour intervals of the animation are 1.0 × 10⁻⁵ for k=0.09 and 4.0 × 10⁻⁷ for k=0.04, respectively. |
Figure D-4: Same as figure D-3, but for westward crossing mode at k=0.32. Contour intervals (left) are 2.0 × 10⁻⁵. Click [Animation] to show dispersion curves for various values of k around c=1.00. Contour intervals of the animation are 4.0 × 10⁻⁷ for k=0.13 and 2.0 × 10⁻⁵ for k=0.32, respectively. |
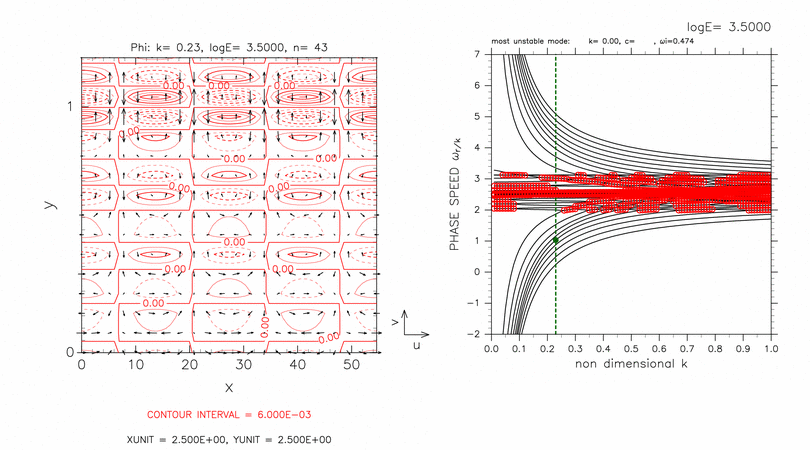
Figures D-5 and D-6 show the result of a case with a computational domain 0.0 < y < 1.2 for log E=3.50. In this case, there exist two grid points on the north of the inertially unstable region. Dispersion curves of crossing modes do not intersect nearby dispersion curves of other gravity modes at this value of E. Dispersion curves of neutral modes as well as crossing modes exist outside of dispersion curves of continuous modes.
Although dispersion curves of crossing modes can not be identified only by figures D-5 and D-6, their curves can be identified by observing dispersion curves with increasing the value of E gradually until phase speed of neutral modes approach c=2.5. For log E=3.50, two dispersion curves of eastward crossing modes (figure D-5) exist outside of dispersion curves of neutral modes, while two dispersion curves of westward crossing modes (figure D-6) exist inside of dispersion curves of neutral modes.
Eastward (figure D-5) and westward (figure D-6) crossing modes have large amplitude near the north boundary although their dispersion curves do not intersect those of nearby other inertial gravity modes.

|
|
| [Animation] | [Animation] |
|
Figure D-5: Same as figure D-1, but for eastward crossing modes for log E=3.50, k=0.24. Contour intervals (left) are 4.5 × 10⁻². Click [Animation] to show dispersion curves for various values of k around c=5.00. The position of crossing modes and neutral modes are indicated by green filled circles and blue filled circles, respectively in the right panel of the animation. Contour intervals of the animation are 4.5 × 10⁻². |
Figure D-6: Same as figure D-5, but for westward crossing modes for k=0.23. Contour intervals (left) are 6.0 × 10⁻³. Click [Animation] to show dispersion curves for various values of k around c=1.00. Contour intervals of the animation are 6.0 × 10⁻³. |
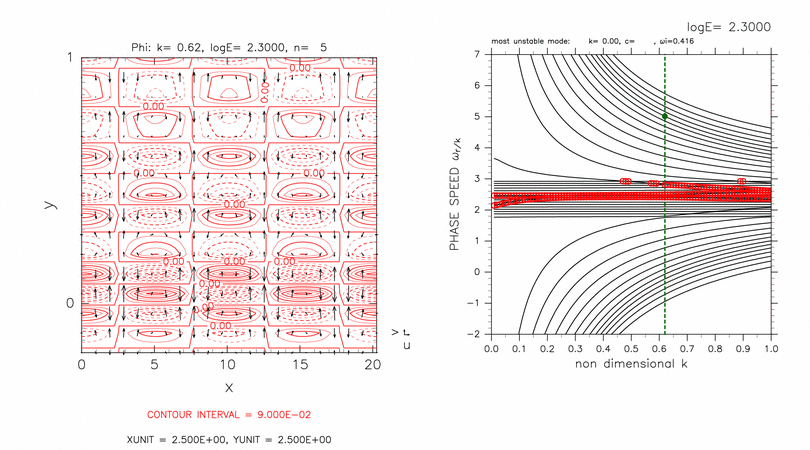
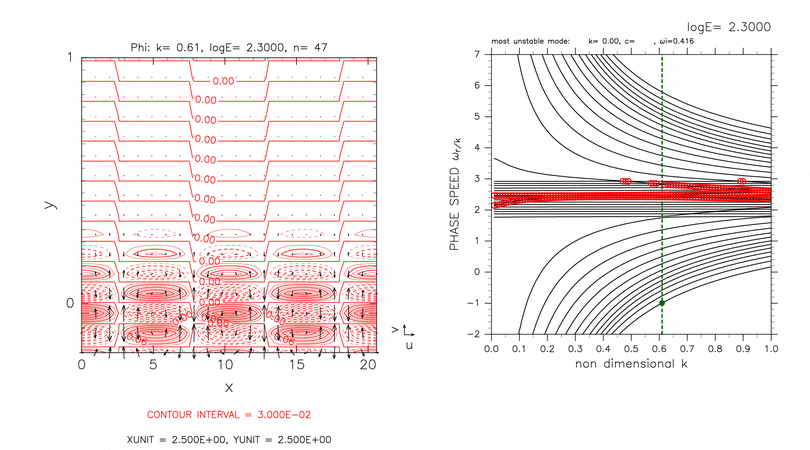
Figures D-7 and D-8 show the result of a case with a computational domain -0.2 < y < 1.0 for log E=2.30. In this case, there exist two grid points on the south of the inertially unstable region. Dispersion curves of crossing modes do not intersect nearby dispersion curves of other gravity modes at this value of E. Dispersion curves of neutral modes as well as crossing modes remain outside of dispersion curves of continuous modes.
Although dispersion curves of crossing modes can not be identified only by figures D-7 and D-8, same as figures D-5 and D-6, their curves can be identified by observing dispersion curves with increasing the value of E. For log E=2.30, two dispersion curves of eastward crossing modes (figure D-7) exist inside of dispersion curves of neutral modes, while two dispersion curves of westward crossing modes (figure D-8) exist outside of dispersion curves of neutral modes.
Eastward (figure D-7) and westward (figure D-8) crossing modes have large amplitude near the south boundary although their dispersion curves do not intersect those of nearby other inertial gravity modes.
|
|
| [Animation] | [Animation] |
|
Figure D-7: Same as figure D-3, but for eastward crossing modes for log E=2.30, k=0.62. Contour intervals (left) are 9.0 × 10⁻². Click [Animation] to show dispersion curves for various values of k around c=5.00. The position of crossing modes and other neutral modes are indicated by green filled circles and blue filled circles, respectively in the right panel of the animation. Contour intervals of the animation are 9.0 × 10⁻². |
Figure D-8: Same as figure D-7, but for westward crossing mode for k=0.61. Contour intervals (left) are 3.0 × 10⁻². Click [Animation] to show dispersion curves for various values of k around c=-1.00. Contour intervals of the animation are 3.0 × 10⁻². |
![[Animation]](./images/phase-struct_logE=+7.50-n_1-2-anim-0.00_y_1.20-fixcint.gif)
![[Animation]](./images/phase-struct_logE=+7.50-n_46-47-anim-0.00_y_1.20-fixcint.gif)
![[Animation]](./images/phase-struct_logE=+7.50-n_1-2-anim_-0.20_y_1.00-fixcint.gif)
![[Animation]](./images/phase-struct_logE=+7.50-n_46-47-anim_-0.20_y_1.00-fixcint.gif)
![[Animation]](./images/phase-struct_logE=+3.50-n_1-9-anim-0.00_y_1.20-fixcint.gif)
![[Animation]](./images/phase-struct_logE=+3.50-n_39-47-anim-0.00_y_1.20-fixcint.gif)
![[Animation]](./images/phase-struct_logE=+2.30-n_1-13-anim_-0.20_y_1.00-fixcint.gif)
![[Animation]](./images/phase-struct_logE=+2.30-n_35-47-anim_0.20_y_1.00-fixcint.gif)