TI2006 showed that the lowest order symmetric (k=0) unstable modes are caused by resonance between equatorial Kelvin modes and westward mixed Rossby-gravity modes (table 1). However, resonating neutral modes causing high-order symmetric unstable modes were not examined. In this section, we clarify the resonating neutral modes causing high-order symmetric unstable modes by examining dispersion curves for the value of E which were not discussed in TI2006. The results give physical interpretations for all of zonally symmetric unstable modes obtained by Stevens (1983) from the viewpoint of the concept of resonance between neutral waves. The calculation domain is -2.00 ≤ y ≤ 3.00 (figure 1) same as TI2006.
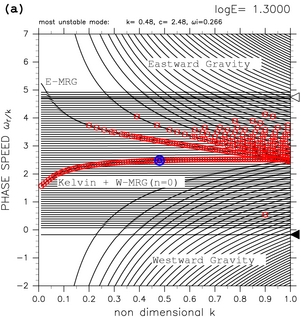
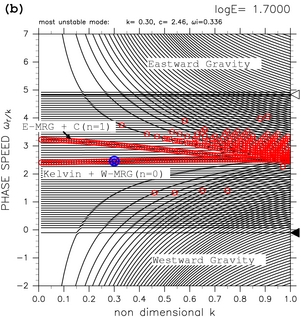
Figure 4 shows dispersion curves for log E=1.30, log E=1.70, and log E=2.40. For log E=1.30 (figure 4a), there exists only one dispersion curve which have zonally symmetric (k=0) unstable mode (labeled as Kelvin + W-MRG (n=0) in the figure). On this dispersion curve, all modes are unstable. These unstable modes are casued by resonance between equatorial Kelvin modes and westward mixed Rossby-gravity modes (TI2006). For log E=1.70 (figure 4b), there exist two dispersion curves which have zonally symmetric unstable modes. The new symmetric unstable mode (labeled as E-MRG + C (n=1) ) is caused by resonance between eastward mixed Rossby-gravity modes (E-MRG) and continuous modes. One more symmetric unstable mode (labeled as E-G + C (n=2) in figure 4c) emerges for log E=2.40. This unstable mode is caused by resonance between the lowest order eastward inertial gravity modes (E-G) and continuous modes. With the increas of the value of E, the number of zonally symmetric unstable modes increases (animation of figure 4). These high-order symmetric unstable modes are caused by resonance between high-order eastward inertial gravity modes and continuous modes.
 |
 |
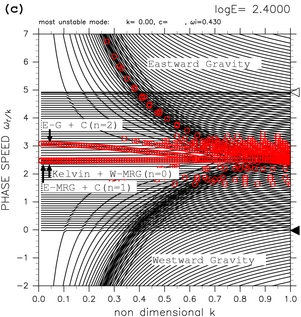 |
Figure 4: Dispersion curves that have symmetric unstable modes for (a) log E=1.30, (b) log E=1.70, and (c) log E=2.40. Labels "Kelvin + W-MRG", "E-MRG + C", and "E-G + C" indicate unstable modes caused by resonance of equatorial Kelvin modes and westward mixed Rossby-gravity modes, unstable modes caused by resonance of eastward mixed Rossby-gravity modes and continuous modes, and unstable modes caused by resonance of eastward inertial gravity modes and continuous modes, respectively. Symmetric unstable modes (k=0) are not shown in these figures. Refer to the caption of table 1 for the meaning of symbols. Click [Animation] to show the change of dispersion curves with varying the values of E.
Growth rate of symmetric unstable modes obtained in this study shows good correspondence with the values obtained theoretically by Stevens (1983). With nondimensional quantities used in this study, the equation of growth rate obtained by Stevens (1983) becomes
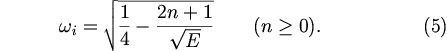
where n is the order of Hermite function which constitutes eigenfunction. Growth rates of symmetric unstable modes obtained by equation (5) are shown by dashed black lines in figure 5. With the increase of mode number n, critical value of E where each mode becomes unstable increases. In thie figure, numerically obtained growth rates of symmetric unstable modes are also shown by color circles. Critical values and growth rates for smaller value of E coincide for analytic solutions and numerical obtained values. This result indicates that unstable mode of n=1 corresponds to numerically obtained unstable mode caused by resonance between eastward mixed Rossby-gravity modes and continuous modes. Unstable mode of n=2 corresponds to numerically obtained unstable mode caused by resonance between eastward inertial gravity modes and continuous modes.
Numerically obtained asymptotic values of growth rate for E→∞ are smaller than those of analytic solutions. The difference can be considered to be resulted from the shortage of resolution of numerical calculation. The asymptotic values become closer to theoretical values in the case with larger number of grid points (figures not shown).
Figure 5: Growth rate of zonally symmetric unstable modes as a function of E. Black dashed lines indicate analytic solution of equation (5) obtained by Stevens (1983) for n=0, n=1, and n=2. Red, green, blue circles are numerically obtained growth rates of symmetric unstable modes. Red circles indecate unstable modes caused by resonance between equatorial Kelvin modes and westward mixed Rossby-gravity modes. Green circles indecate unstable modes caused by resonance between eastward mixed Rossby-gravity modes (E-MRG) and continuous modes. Blue circles indecate unstable modes caused by resonance between eastward inertial gravity modes (E-G) and continuous modes.