| Development of a Cloud Convection Model for Jupiter's Atmosphere | << Prev | Index| Next >> |
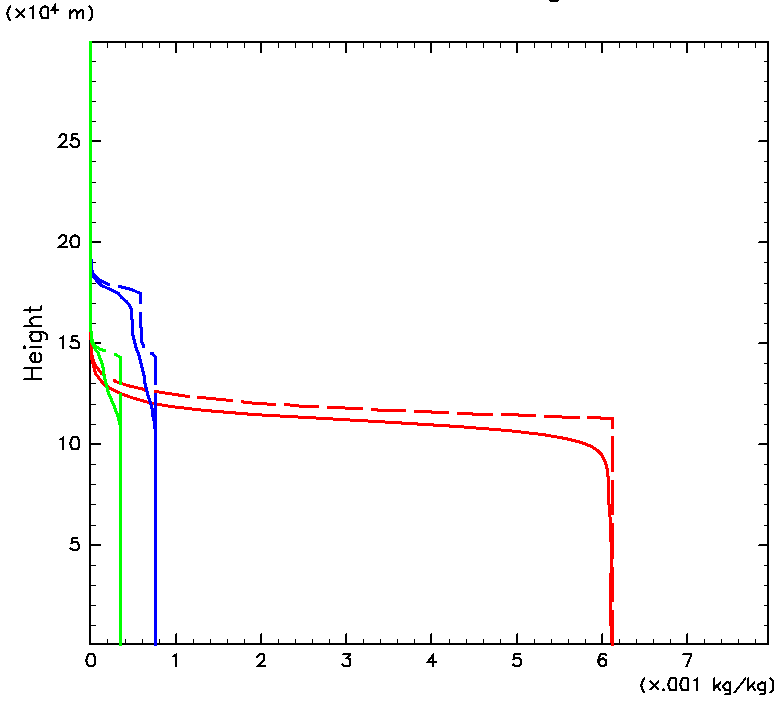
The vertical profiles of time and horizontal mean mixing ratios of condensible volatiles are shown in Fig. 3.3. All of the mixing ratios are almost constant below the H2O condensation level. The mixing ratios of NH3 and H2S start to decrease with height not at their respective condensation levels but at the H2O condensation level. This characteristic is obviously different from those expected from one-dimensional thermodynamic calculations.
Time and horizontal mean cloud mixing ratios are shown in Fig. 3.4. Considerable amounts of H2O and NH4SH cloud particles are observed above the NH3 condensation level, not only in animation (Fig. 3.2 a) but also in the space-time average. This characteristic of the profiles is obviously different from the well-separated three-layer structure that would be expected by the previous thermodynamical equilibrium calculations (eg. Fig. 1.1).
Figure 3.3: Vertical profiles of time and horizontal mean mixing ratio of condensible volatiles. Red, blue, and green lines show H2O, NH3, and H2S vapor mixing ratios, respectively. Solid lines denote the profiles obtained by our simulation, while dashed lines, the profiles calculated by a thermodynamical equilibrium calculation. The profiles are given by averaging from 0.9 × 10⁶ to 1.0 × 10⁶ sec.

Figure 3.4: Vertical profiles of time and horizontal mean cloud mixing ratios. Red, blue, and green lines denote H2O, NH3, and NH4SH cloud mixing ratio, respectively. The profiles are given by averaging from 0.9 × 10⁶ to 1.0 × 10⁶ sec.
| Development of a Cloud Convection Model for Jupiter's Atmosphere | << Prev | Index| Next >> |