| 3. Results with Kuo scheme | [prev] [index] [next] |
In this subsection, we examine sensitivity of longitudinal-temporal variation of precipitation along the equator to the vertical profile of radiative cooling for the experiment with Kuo scheme. We show the enhanced wavenumber-frequency power spectra of north-south symmetric component which are produced following Wheeler and Kiladis (1999) (See Appendix B.2 for the brief description of the calculation procedure).
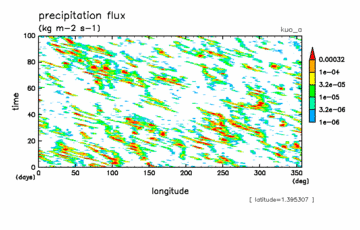
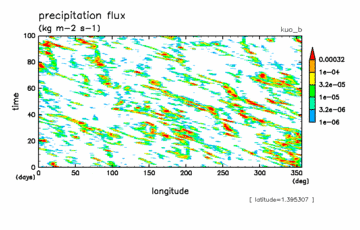
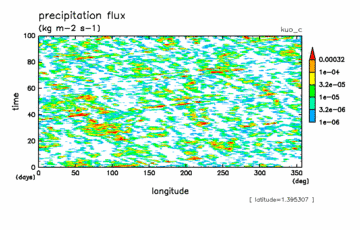
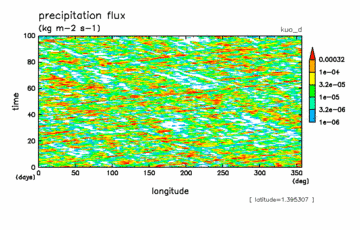
Fig.3.4 show time-longitude cross sections of precipitation along the equator. It is recognized that, for all cases, precipitation takes in a form of events which appear for a duration of the order of a day with a small horizontal scale near the limit of spatial resolution. These events are referred to as grid-scale precipitation activity or events (HS86). They do not appear randomly but appear as sequences which can be traced for the period of about 3 to 20 days. Those sequences do not appear randomly, either; a long and large scale variation seems to exist in their intensity of activity. The active region of sequences appear with a longitudinal scale of about 100 degree and of a duration of about 30 day.
The appearance of qrid-scale precipitation activity depends on the vertical profile of radiative cooling. When cooling rate has its peak in the lower troposphere (cases kuo_a and kuo_b), the sequences of qrid-scale precipitation activity propagate westward, whiel the variation of those sequences seem to propagate eastward. When cooling rate has its peak in the upper troposphere (cases kuo_a and kuo_b), on the other hand, the sequences propagate eastward, whiel the variation of those sequences seem to propagate westward.
We should notify that, compared to the longitude-time cross section of precipitation by Numaguti and Hayashi (1991), where the cumulus parameterization utilized is Kuo scheme and the set up of experiment is similar, the number of eastward sequences of grid-scale precipitation is small in Fig.3.4, and a wave number one signal dominates in the present experiment.
|
|
|
|
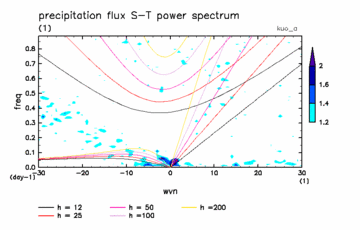
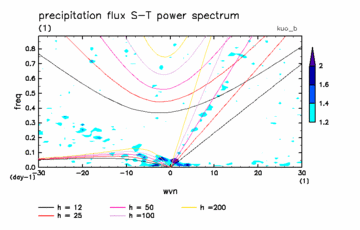
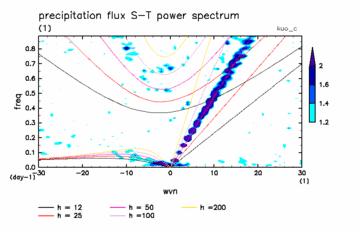
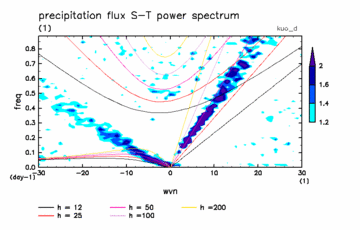
| Fig.3.5: Wavenumber-frequency power spectra of north-south symmetric component of precipitation around the equator of the four cases with Kuo scheme. (upper left) kuo-a, (upper right) kuo-b, (lower left) kuo-c, (lower right) kuo-d. Data are the same as for Fig.3.4. Unit is non-dimensional, since enhance technique by Wheeler and Kiladis (1999) is utilized (See Appendix B.2 for the description of calculation). Lines represent the dispersion relations of equatorial waves with odd longitudinal indices. Labels represent values of equivalent depths for corresponding lines, which are 12, 25, 50, 100, and 200 [m], respectively. | |
Fig.3.5 shows wavenumber-frequency power spectra of equatorially symmetric component of precipitation around the equator. As for the eastward signals, although wavenumber regions of dominant signals are different, their eastward speeds are about 22 [m s-1] for all cases, corresponding to the Kelvin wave dispersion relation with the equivalent depth of 50 [m]. As for the westward signals, careful observation of Fig.3.5 indicates that, for all cases, their speeds are different between for the low wavenumber components from 1 to about 6 and for those with the higher wavenumbers. The components with the higher wavenumbers are non dispersive, and have westward speeds of around 3-5[m s-1] independent of wavenumber for all cases. This is the speed of zonal wind in the lower atmosphere (Fig.3.2). The components with the lower wavenumbers may be recognized to have the slower westward speeds; these signals seem to be on the dispersion relation of Rossby waves with the equivalent depth of 50[m], which is the same as that of Kelvin wave for eastward signals mentioned above. In addition to those eastward and westward signals, we can also recognize high frequency signals in Fig.3.5. Those high frequency signals are located in the region of inertio-gravity waves with the equivalent depth smaller than 200[m], which is the equivalent depth corresponding to the first mode of troposphere.
The equivalent depth that explains the phase speeds of equatorial waves corresponding to the precipitation signals is quite smaller than that of the first mode of troposphere. This suggests that in those disturbances associated with precipitation there are interactions between waves and condensation heating.
| [prev] [index] [next] |