F. Atmospheric Structure in the Runaway Greenhouse State |
c. Meridional Structure
In this section, the meridional distributions of temperature, water vapor, and circulation field in Experiment S1800 are illustrated. The figures illustrated in this section show the distributions of the zonal means of these physical variables averaged over the period between Days 870 and 920. Although all physical variables are subject to temporal changes in a runaway greenhouse state, the temporal means are evaluated over this time period in order to eliminate the noise that appears in instantaneous values.
Compared to the temperature distribution in equilibrium states, the temperature distribution in the runaway greenhouse state (Figure 1) is characterized by the disappearance of the meridional temperature difference as well as higher values of temperature. At altitudes higher than σ = 0.8, temperature in the tropics is higher than that in mid-latitudes. In contrast, in the lower layer, temperature in mid-latitudes is higher than that in the tropics. The latitudes characterized by high temperatures in the mid-tropospheric layer coincide with the latitudes subject to condensation heating (refer to Atmospheric Structure of the Runaway Greenhouse State: Meridional Thermal Structure). The temperature distribution in the lower layer follows the surface temperature distribution. The peak values of mass stream function are larger than those in equilibrium states. This result is presumably affected significantly by the increased atmospheric density caused by the increased water vapor content. The strength of the circulations (e.g., the magnitude of meridional wind) is not as large as that in equilibrium states. In terms of geometry, the Hadley circulation in this figure is much taller than that in equilibrium states, even though the width of the circulation is almost the same as those in equilibrium states. However, because there exist significant temporal variations of the physical variables in Experiment S1800, it should be noted that the Hadley circulation seen on this figure is not always necessarily present. |
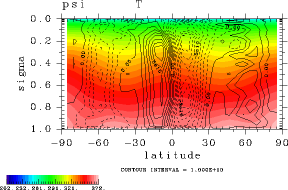 Figure 1:Meridional distribution of temperature (K) and mass stream function (kg/sec) in Experiment S1800. |
The distribution of condensation heating (Figure 2) reveals that the tropospheric height is quite high and the tropopause height is σ = 0.003. In this case, condensation heating takes place almost exclusively in the upper troposphere, unlike in the cases of equilibrium states. This result is probably attributable to the condition that radiative cooling occurs only in the upper layer in response to the very optically thick atmosphere. However, no thorough investigation has been made on this point. The exact cause will be examined in future research. |
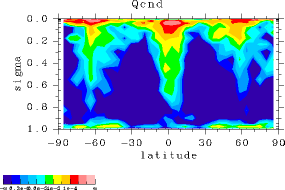 Figure 2:Meridional distribution of condensation heating (K/sec) in Experiment S1800. |
The meridional pattern of specific humidity in the tropics (Figure 3) is equivalent to the pattern that can be obtained by vertically stretching the distribution pattern of specific humidity in the tropics in equilibrium states. In the polar regions, the water vapor content becomes larger than that in equilibrium states. As can be seen from the difference in latent heat energy between the cases of the runaway greenhouse state and the equilibrium states, the water vapor content in the runaway greenhouse state is approximately ten times those in equilibrium states. Therefore, the total optical depth is 30 in the runaway greenhouse state (the optical depth is shown in Figure 4). The runaway greenhouse state shows an increased water vapor content at high latitudes and almost no meridional difference in relative humidity near the surface, contrary to equilibrium states. |
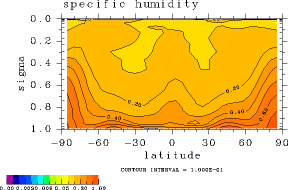 Figure 3: Meridional distribution of specific humidity (kg/kg) in Experiment S1800.
|
The values of relative humidity in the runaway greenhouse state are smaller than those in equilibrium states. Specifically, relative humidity is approximately 30% near the height of σ = 0.7 at 30° latitude north and south. This result can be explained by the fact that the water vapor content is small around these locations, even though the temperature at those latitudes is almost the same as that in the equatorial region. |
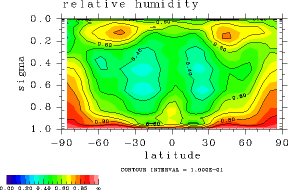 Figure 5:Meridional distribution of relative humidity in Experiment S1800. |
The zonal wind distribution is equivalent to the shape that can be obtained by vertically stretching the zonal wind distribution in equilibrium states. As is confirmed from mass stream function, the Hadley cells become tall in the runaway greenhouse state. Therefore, the positions of the subtropical jets are higher than the maximum height shown in this figure. |
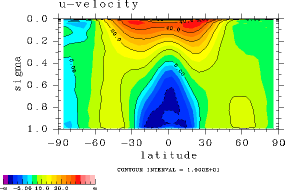 Figure 6:Meridional distribution of zonal wind (m/sec) in Experiment S1800. |
Meridional Structure of the Upper Layer
Figures shown below illustrating meridional structures for whole model domain will be presented. The temperature distribution (Figure 7a) shows almost no meridional difference in the upper layer similar to what is found in the troposphere. Since temperature decreases monotonically with height at all latitudes, the position of the tropopause is not evident in the temperature distribution. The zonal wind distribution (Figure 7b) reveals that the positions of the subtropical jets are raised to σ = 10-2. In terms of physical height, this height corresponds to approximately 50 km. Presumably, the polar night jets are raised to approximately logσ = -5. Unfortunately, they have been crushed due to Rayleigh friction and thus cannot be identified. Although the region of westerly winds above the equator is likewise raised, it has also been crushed and is not identifiable in the figure. |
(a) 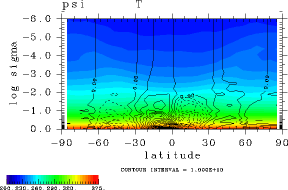 (b) |