E. Atmospheric Structure in Equilibrium States |
E. Atmospheric Structure in Equilibrium States |
i. Meridional Distribution of Energy Flux
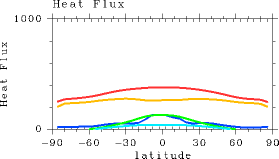
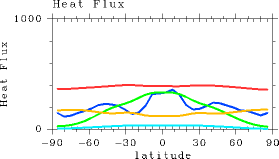
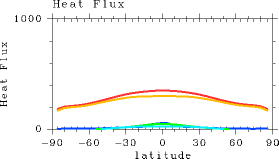
In this section, changes in the energy budget of equilibrium states associated with an increased solar constant will be surveyed in order to clarify the reduction in the meridional thermal contrast caused by an increasing solar constant. Figure 1 shows the meridional distributions of energy fluxes from Experiment S1380. In terms of the partitioning of energy fluxes into the atmosphere from the surface, the following trends exist. In the tropics, the energy budget consists of surface net radiative flux and evaporation flux. In the other regions, the energy budget consists mostly of the surface net radiative flux alone. In terms of the atmospheric heat budget, condensation heating is in balance with the net radiative cooling (equal to the value obtained by subtracting surface net radiative flux from OLR) in the tropics. In the atmosphere at high latitudes, OLR and surface net radiative flux are roughly equal in magnitude, and thus can be considered in balance. An examination of this figure from the perspective of the water vapor budget reveals that evaporation and precipitation are roughly in balance in the equatorial region. A comparison of the meridional distributions of energy fluxes from Experiment S1570 (Figure 2) and that from Experiment S1380 shows differences including 1) the meridional difference in OLR becomes smaller in Experiment S1570 than in Experiment S1380, and 2) evaporation flux dominates the surface flux budget of Experiment S1570 due to the increased SLR. First, surface fluxes are examined. With an increasing amount of incident radiation, the atmosphere becomes optically thick and thus surface radiative fluxes decrease, which causes an increase in evaporation flux. Evaporation flux becomes especially dominant in the equatorial region. Because the evaporation process provides negative feedback to the surface temperature change, the increase in surface temperature in the equatorial region becomes lower than that in high latitude regions. In addition, the value of precipitation flux, which is a heat source for the atmosphere, becomes notable in the form of local peaks in the equatorial region and around 60° latitude north and south. High latitude regions are heated by the increased condensation heating around 60° latitude north and south. Because the thermal fields of the atmosphere changes between Experiments S1380 and S1570 as described above, the meridional differences in surface temperature and OLR become smaller in Experiment S1570 than in Experiment S1380. The water vapor budget of Experiment S1570 is broadly the same as that of Experiment S1380. However, precipitation exceeds evaporation significantly at high latitudes. The water vapor deficit at high latitudes is compensated for by the transport of water vapor that originated from evaporation of water around latitudes 30° latitude north and south. According to the meridional distributions of energy fluxes from Experiment S1200, the effect of precipitation becomes quite small in this case (Figure 3). Most of fluxes originating from the surface are in the form of surface net radiative flux and are roughly balanced by the radiative cooling of the atmosphere. The energy budget is determined by radiative fluxes alone, demonstrating the state of a dry atmosphere containing no water vapor. |
|
| E.i. Meridional Distribution of Energy Flux |