D. Results from Calculations with a Single Damping Layer |
c. Equilibrium State: Meridional Distribution of Energy Flux
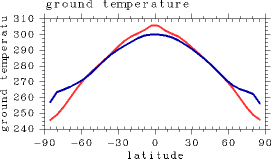
| Figure 1 shows the meridional distribution of surface temperature. This figure also includes the results from Experiment S1380 (blue), which implemented seven damping layers and a Shapiro-type vertical filter. The values of surface temperature in the equatorial and polar regions in Experiment S1380 are lower and higher, respectively, than those from the case with a single damping layer. Therefore, the meridional temperature difference in Experiment S1380 is smaller than that in the case with a single damping layer. While the meridional surface temperature difference in the case with a single damping layer is approximately 60 K, the difference in Experiment S1380 is 45 K. | 
Figure 1: Meridional surface temperature distributions (K). Red: without filtering and with a single damping layer. Blue: Experiment S1380. |
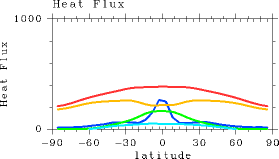
Figure 2(a) shows meridional distributions of the condensation heating rate, evaporative flux, sensible heat flux, OLR, and net upward radiative flux at the surface from the case with a single damping layer. At the equator, evaporation (green) exceeds precipitation (blue). This moisture budget is maintained by the transport of water vapor which originated from evaporation of liquid water at 20° latitude north and south. This feature represents a successful reconstruction of the state of the Earth's atmosphere by the model. However, the precipitation amounts in the mid- to high latitudes are significantly smaller than those in the actual Earth's atmosphere. Unfortunately, it appears that the present model is unable to fully simulate baroclinic disturbances.
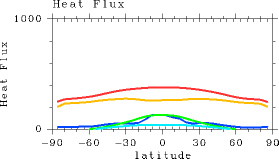
In contrast, the model with filtering implemented yields decreased precipitation at the equator (Figure 2b). Coinciding with decreased precipitation, surface radiative flux at the equator increases. The cause of decreased precipitation and increased surface radiative flux at the equator remains unknown and will be addressed in future research.
(a)  |
(b)  |
| Figure 2: Meridional energy flux distribution (W/m2). (a) Without filtering and with a single damping layer. (b) Experiment S1380 (filtering included in all layers, seven damping layers). Blue: condensation heating. Green: evaporative flux. Red: OLR . Light brown: surface net radiative flux. Aqua: sensible heat flux. The value of solar constant used for these model runs is S = 1380 W/m2. Both (a) and (b) show the zonal mean values time-averaged over the period between Day 950 and Day 1000. | |
The reduction of precipitation implies changes in the heat budget of the entire atmosphere. Table 2 shows the global mean values of various energy fluxes for the case with a single damping layer and Experiment S1380. The implementation of filtering causes no change in the global mean value of OLR. In this sense, it can be claimed that energy loss brought forth by the inclusion of filtering and damping layer can be neglected. Nonetheless, the partitioning of surface energy flux components changes as a result of the inclusion of the filtering and damping layer. The use of the filter and damping layer causes evaporative and sensible heat fluxes to decrease and radiative flux to increase. Furthermore, precipitation decreases in response to these changes.
| Experiment name | Precipitation (W/m2) |
Evaporative flux (W/m2) |
Sensible heat flux (W/m2) |
OLR (W/m2) |
SSR (W/m2) |
| Single damping layer only | 76.6 | 76.4 | 29.4 | 343.7 | 237.9 |
| Experimant S1380 | 62.0 | 62.0 | 19.7 | 343.7 | 261.9 |
Figure 2: Global mean values of various energy fluxes. The reported values are for 1) the case with a single damping layer and with no filtering and 2) Experiment S1380 (filtering included in all layers, seven damping layers). SSR represents net upward radiative flux at the surface.