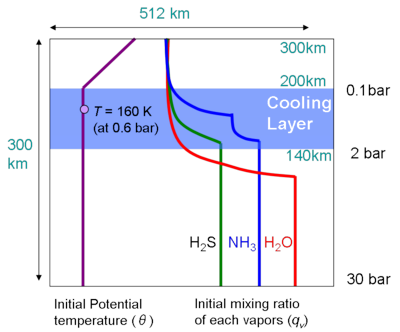
Figure 3.1: Schematic figure of set-up of the experiment.
| Development of a Cloud Convection Model for Jupiter's Atmosphere | << Prev | Index| Next >> |
The domain extends 300 km (30 bar - 0.001 bar) in the vertical direction and 512 km in the horizontal direction. The spatial resolution is 2 km in both the horizontal and the vertical directions.
The model atmosphere is subjected to externally given thermal forcing as a substitute for both radiative cooling near the tropopause and heating supplied by convection in the deep atmosphere. Thermal cooling near the tropopause is applied between the 2 bar level (z = 140 km) and 0.1 bar level (z = 200 km) which is the layer of net cooling observed by the Galileo radiation probe [14]. The cooling rate is set to be -1 K/day following the setting of Nakajima et al. (2000) [6], which is about 100 times larger than that appropriate for Jupiter's atmosphere. The thermal heating from the deep atmosphere is given as a boundary condition.
The cyclic boundary condition is applied in the horizontal direction. At the upper boundary, the conditions of stress-free, no normal flow, no heat flux, and no mixing ratio flux of each condensible volatiles are assumed. At the lower boundary, the conditions of stress-free and no normal flow are assumed, and the potential temperature and mixing ratios are kept constant at their initial values, assuming that the convection of deep atmosphere supplies heat and condensible volatiles. The diffusion coefficient at the lower boundary is held at a constant value of k = 800 m2s-1.
The initial vertical profile of temperature is given as 160 K at 0.6 bar, adiabatic from the lower boundary to z = 200 km (p = 0.1 bar), and isothermal above. Random potential temperature perturbations (Δθ = 0.1 K) are given at the grid points on the 110-km level to seed convective motion.
At the lower boundary, abundances of condensible elements relative to hydrogen are the same as the solar abundance [9]. The mixing ratio of each condensible species is homogeneous between the lower boundary and to the altitude near the condensation level. At altitudes above that level, all mixing ratios are set to be slightly below their respective saturated value. The details are given in Appendix E.
Time integration is continued up to about 106 sec (about 300 hours). At the final stage, quasi-equilibration of the horizontally averaged atmospheric structure seems to be established.

|
|
Figure 3.1: Schematic figure of set-up of the experiment. |
| Development of a Cloud Convection Model for Jupiter's Atmosphere | << Prev | Index| Next >> |