|
Appendix C. Comparison with Numaguti and Hayashi (1991)
|
[prev]
[index]
[next]
|
Here, we present comparison between the results
of present study and those of
Numaguti and Hayashi (1991),
which is a previous study with almost the same setup.
Both study perform numerical calculation with Kuo scheme,
and the complexity of the models are at the similar level.
As will be summrized below,
we could not duplicate the results of the previous study
in the following two points.
We have to confess, at the moment, that
we do not figure out the causes of the difference
between the results of present study and those of the previous one.
However, actual models utilized are different;
the model of Numaguti and Hayashi (1991)
is, the same as HS86,
the earliest version of numerical weather prediction model
of Japan Meteorological Agency,
while the model of the present study is
a rewritten model based on that of HS86.
The basic architecture of the dynamical process is the same,
but there are some difference in the physical processes,
and moreover there may be some difference in
the values of parameters such as radiation properties.
The most important difference is the profile of
SST (sea surface temperature).
The profile of SST in Numaguti and Hayashi (1991)
is the same as that of HS86,
which is calculated as the north-south symmetric component
of the zonally averaged observed real SST profile,
while that of the present study is, as shown in
Fig.1.2, artificial.
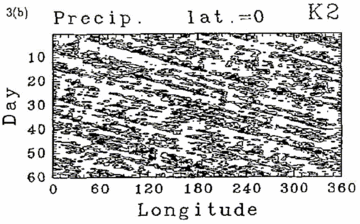
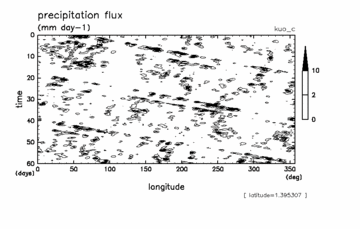
Compared with the result of the corresponding experiment
in Numaguti and Hayashi (1991),
case kuo-c or case kuo-d in the present study is characterized with
stronger wavenumber one signal and
smaller number of sequences of grid-scale precipitation events.
We have performed aditional simulations with
various values of absorption coefficient of radiation,
we have not succeeded in reproducing a
similar longitude-time section of precipitation along the equator
as that of the previous study.
Numaguti and Hayashi (1991)
argue that the wave-CISK dynamics contributes the
maintainance of the eastward propagating grid-scale precipitation structure.
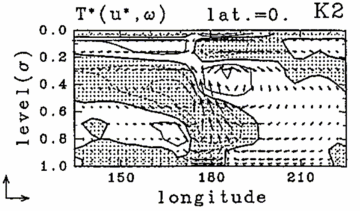
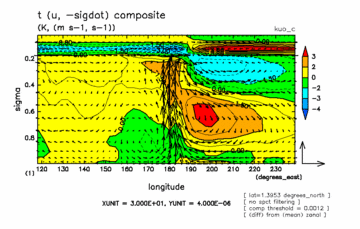
The composite structure obtained in the present study
referring to the eastward propagating grid-scale precipitation events is
characterized by the westward phase tilt of temperature and wind fields,
and temperature structure considerably dominated by
the second vertical mode with two peaks in
the upper and the lower troposphere,
which confirm the argument of the previous study.
On the other hand, there are some features different from those
in Numaguti and Hayashi (1991), such as
a strong downward motion in the upper level just to the east
(at around 190E) of the precipitation region,
and an intense warm area in the upper level to the west, etc.

|

|
|
Fig.C.2:
Composite structure referring to
the eastward propagating grid-scale precipitation events.
Longitude height cross section of
temperature anomaly at the equator from the longitudinal mean
(unit is [K]).
Arrows indicate wind velocity anomaly from the longitudinal mean
(unit is [m s-1, s-1]).
(left)
Numaguti and Hayashi (1991)fig.8b.
Contour interval is 0.2 [K], and negative region is hatched.
The arrows at the lower left corner indicates ??? m/s, ?????/s.
(right) case kuo-c, the same as
Fig.3.10(upper right).
|


