

| 3. Results of the experiments with Kuo scheme | [prev] [index] [next] |
In the previous subsection, we observed that precipitation activity along the equator responds systematically to the change of the vertical profile of radiative cooling. As for the grid scale precipitation activity it occurs in the form a seriese of coherent sequences of events. Grid scale precipitation events propagate westward in cases kuo_a and kuo_b where cooling at the lower level is intensified, while they propagate eastward in cases kuo_c and kuo_d where cooling at the upper level is intensified.
In this subsection, we examine the circulation structure and time evolution of the grid scale precipitation events by observing time series of data with the higher temporal resolution (2 hours) compared to that used for Fig.3.4 and animation of them. We select cases kuo_a and kuo_c among the four cases as the representatives of lower level cooling and upper level cooling cases, respectively, and present precipitation, specific humidity, and circulation fields.
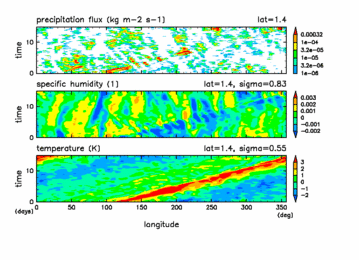
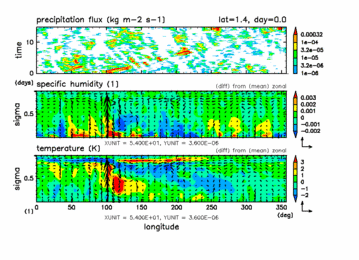
Fig.3.6 shows the time developments of precipitation, specific humidity, temperature and wind field along the equator of the upper level cooling experiment (case kuo_c). A notable feature directly corresponding to the grid scale precipitation activity is an existence of grid scale strong upward motion. (middle and lower right panels of Fig.3.6; movie). Although the upward motion appears intermittently in accordance with the variation of precipitation intensity, the upward area moves eastward along with the eastward motion of the precipitation area. Occasionally, there seem to exit a strong upward motions independently of precipitation. However, those updrafts are caused by strong precipitation events near but off the equator (not shown here). In the temperature field (Fig.3.6 lower panels), the most notable feature is the eastward temperature anomaly which is associated with the eastward precipitation peak that extends longitudinally for about several thousands of kilometers. The spatial structure of the anomaly is, at the middle and the lower troposphere where the intensity of the anomaly is large, positive to the east of the precipitation area and negative to the west. The phase of the anomaly seems to be tilted westward as the increase of altitude. In spite of the violent temporal variation of precipitation and upward motion, the spatial structure of the temperature anomaly is preserved fairly coherently during its eastward motion.
In the specific humidity field (middle panels of Fig.3.6), we can identify a large-scale structure corresponding to this temperature anomaly; there is, for instance, an eastward moving dry region in the lower troposphere (in about 1-5 [km] height) extending for about 3000 [km] to the east of the precipitation peak. However, more prominent are a large number of nearly grid-scale anomalies appearing in the lowermost troposphere (lower than 1 [km]). These anomalies seem to be enhanced at the precipitation (updraft) events. However, they tend to stand still or move slowly westward, and exist prior to or after the eastward moving precipitation (updraft) events; they might control the location and the intensity of precipitation events.
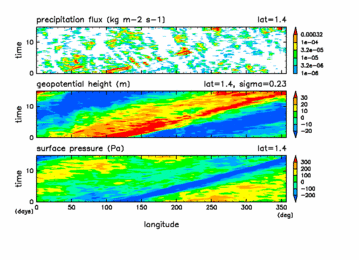
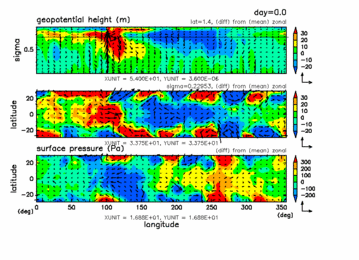
Fig.3.7 shows the time developments of height and surface pressure fields along or around the equator of the upper level cooling experiment (case kuo_c). Corresponding to the eastward propagating temperature structure mentioned above, there exist a notable feature also in the fields of height and surface pressure which propagates to the east coherently. The spatial structure of surface pressure anomaly is negative to the east of the precipitation area and positive to the west. The phase of height anomaly seems to be tilted westward as the increase of altitude, and in the upper troposhpere the sign of height anomaly is opposite to that in the lower troposphere. The height and surface pressure anomaly is localized latitudinally within about 15 degrees from the equator, and the corresponding horizontal wind anomaly is dominated by the east-west component. These features observed in the eastward moving anomaly seen in the filds of temperature and height (surface pressure) indicate that the structure is strongly characterized by the equatorial Kelvin wave properties.
Fig.3.8 shows the time developments of precipitation, specific humidity, temperature and wind field along the equator of the lower level cooling experiment (case kuo_a). As is in the upper level cooling experiment, strong grid scale upward motion appears associated with the grid scale precipitation activity. (middle and lower right panels of Fig.3.8; movie), although intensity of the upward motion is small compared to that of the upper level cooling experiment. In the temperature field (Fig.3.8 lower panels), it is rather hard to recognize temperature variations associated with the grid scale precipitation activity. A notable structure in the temperature field is the existence of eastward moving wave-like anomalies with planetary scales (especially wavenumber one) and with the amplitude peaks located in the middle of the troposphere. The eastward motions of these temperature anomalies are clearly seen in lower left panel of Fig.3.8, in contrast with the westward motions of grid scale precipitation events observed in upper left panel of Fig3.8.
In contrast with the temperature field, in the specific humidity field (middle panels of Fig.3.8), as is in the upper level cooling experiment, a large number of nearly grid-scale structure at the lowermost troposphere (lower than 1 [km]) are clearly identified. Those humidity anomalies seem to be more coherent compared to precipitation events; grid-scale precipitation events seem to occur in the positive anomaly regions of these coherent humidity anomalies. This indicates that the westward sequences of intermittent precipitation events are maintained by the continuity of humidity anomaly. The westward propagation speed of humidity anomalies and grid-scale precipitation events roughly coincides the low level westward wind speed. The westward propagation of grid-scale precipitation events can be explained as the effect of humidity advection by the background wind.
Fig.3.9 shows the time developments of height and surface pressure fields along or around the equator of the lower level cooling experiment (case kuo_a). We can recognize large scale anomalies which can be regarded to correspond the temperature anomaly of planetary scale observed in Fig.3.8. As was in the upper level cooling experiment, the height and surface pressure anomaly is localized latitudinally within about 15 degrees from the equator. The structure is strongly characterized by the equatorial Kelvin wave properties.
| [prev] [index] [next] |