F. Atmospheric Structure in the Runaway Greenhouse State |
d. Meridional Thermal Structure
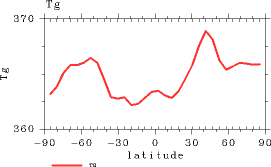
Figure 1 shows the meridional distribution of zonal mean surface temperature. This result differs significantly from that in equilibrium states in that the peak values occur at mid-latitudes. Because the surface temperature distribution is subject to significant temporal variation in the runaway greenhouse state, this figure shows that the maximum value of surface temperature does not necessarily occur at the equator, unlike in the cases in equilibrium states. The meridional temperature difference in this figure is 6.5 K, and thus is quite small. Figure 2 shows the meridional distributions of energy fluxes. It can be said that the surface budget is equivalent to that obtained by enhancing the results from Experiment S1570. That is, surface radiative flux becomes nearly zero due to the optically thick atmosphere, and most of the irradiance absorbed by the surface is transferred into the atmosphere as evaporation flux. Temperature at the equator is lower than that at mid-latitudes since the cooling effect by evaporation presumably becomes significantly high at the equator. The sensible heat flux is nearly zero and takes slightly negative values at high latitudes. In other words, the atmosphere heats up the surface in high-latitude regions. Regarding the energy fluxes in the atmosphere, three peaks in the precipitation become evident. Particularly, precipitation at the equator is approximately 30 mm a day, and significantly larger than that in Experiment S1570. Precipitation occurs in the polar regions, heating up the atmosphere. The meridional distribution of OLR is nearly flat as in the case of Experiment S1570. The value of OLR is 330 W/m2 and agrees roughly with that from the solution obtained in the high-temperature limit of the 1D model that takes into account the relative humidity. |

Figure 1: Meridional distribution of surface temperature (K) in Experiment S1800. The displayed values are the time-average values from the period between Days 870 and 920.
|