3. Results |
h. What Determines a Runaway Limit?
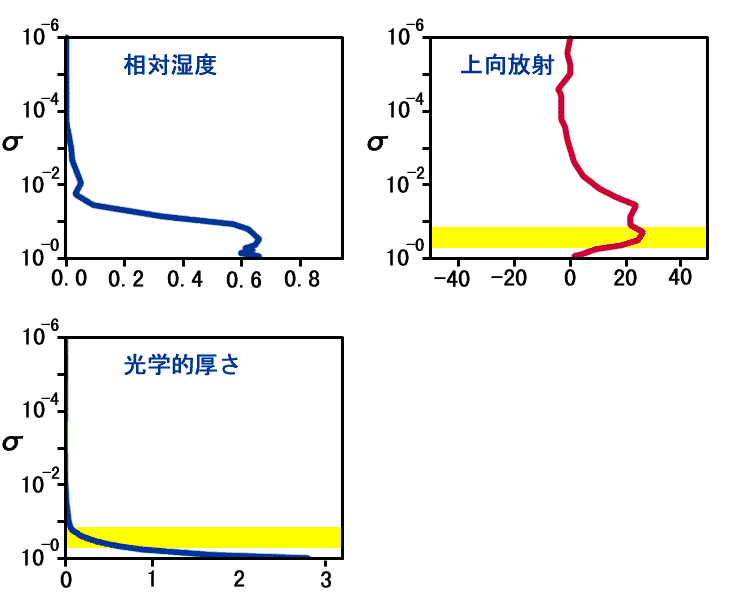
(Examination on the Vertical Structure)Since we are focusing on the tropospheric emissivity constraint, we will now make a detailed examination of the results for S1570, which corresponds to the state that comes the closest to the runaway greenhouse state without entering it. Figure 1 shows the vertical profiles of temperature, relative humidity, and contributions to OLR from each level and optical depth. The following observations are made based on the figure:
|

Figure 1: Vertical distributions of zonal mean
relative humidity (blue line), contribution of each level to OLR
(W/m2, red line), and optical depth (blue line) at 2.77
N. Each value is averaged from Day 950 to Day 1000. The
contribution of each level to OLR reflects the vertical
distribution of upward radiative flux from each level reaching the
top of the atmosphere. The level where that value is highest plays
a important role in determining the OLR.
|
In experiment S1570, the tropopause level is at σ = 0.1 to 0.2, judging from the Condensation Heating Distribution. Combined with the above results, it can be concluded that the value of OLR is determined by the thermal structure of the troposphere. In other words, it appears likely that the asymptotic value of OLR, 400 W/m2, can be represented by the tropospheric emissivity constraint in a 1D radiative-convective equilibrium model. In the next section, we will examine the relationship between the upper limit of outgoing radiation determined using the 1D radiative-convective equilibrium model and the asymptotic value of the OLR in the 3D model.