E. Atmospheric Structure in Equilibrium States |
g. Temperature Distribution and Mass Stream Function (Upper Layer)
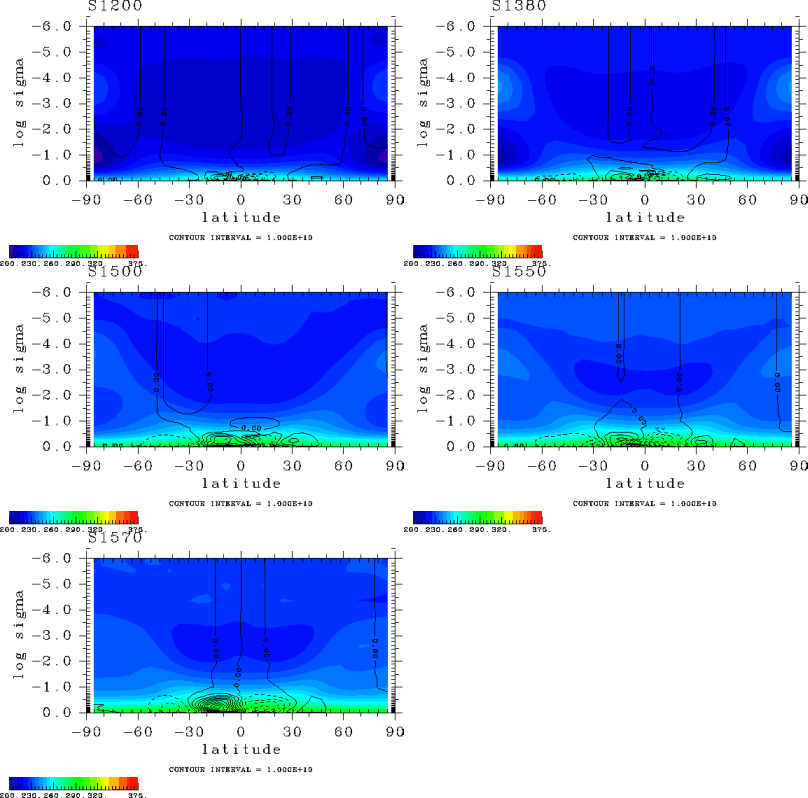
Figure 1 shows the meridional distributions of temperature and mass stream function. In this figure, log10σ is used for the vertical axis. This figure displays the entire model domain, illustrating the changes in the state of the atmosphere in the domain including those in the upper layer clearly.
In the layer above the tropopause, the vertical temperature distribution is nearly constant. With an increasing solar constant, the overall temperature increases. Regarding mass stream function, the vertical extent of the Hadley circulation becomes larger with an increasing solar constant. The meridional circulations above the troposphere are very weak in all cases.

Figure 1: Temperature distributions (K) and mass stream function (kg/sec) in equilibrium states.