D. Results from Calculations with a Single Damping Layer |
d. Equilibrium State: Meridional Energy Transport
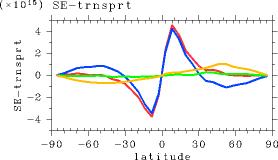
Figures 1(a) and 2(a) show the meridional transport of dry static energy, cpT + gz, and latent heat, Lq, respectively. The distribution of dry static energy transport reveals sharp peaks near 10° latitude north and south (Fig 1a). This result can be explained by the fact that the energy transport at latitudes higher than 10° is significantly smaller in the modeled atmosphere than in the actual Earth's atmosphere (Masuda, 1994). In particular, the amount of energy transported by disturbances at mid- to high latitudes is approximately one third of that on the Earth. It can be presumed that this shortcoming of the model result arose from an inaccurate simulation of baroclinic instabilities. Confirmation of this presumption requires high-resolution calculations and is left as a topic for future research.
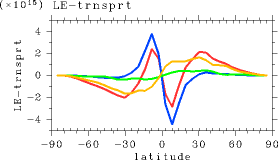
Regarding the latent heat transport (Figure 2(a)), its peaks exist around 20° and 40° latitude north and south. The peaks in the low-latitude regions represent water vapor converging into the equator, which is similar to a trend observed on the actual Earth. Furthermore, each of the peak values of latent heat transport obtained from the model is approximately the same as that observed on the Earth.
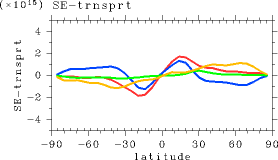
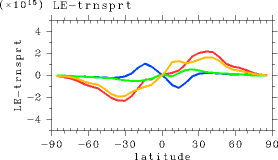
When filtering and a damping layer are implemented, the amount of transported dry static energy in the region of the Hadley circulation decreases significantly (Figure 1(b)). In addition, the amount of equatorward transport of latent heat also decreases in the tropics (Figure 2(b)), creating gentle mountain-shaped patterns in the meridional direction. It can be presumed that these deficiencies are caused by the weakening of the Hadley circulation as described previously.
(a) 
(b) 
Figure 1: Distribution of the meridional transport of dry static energy (W). (a) With no filtering and with a single damping layer. (b) Experiment S1380 (filtering included in all layers, seven damping layers). Red: total transport. Blue: transport by the mean meridional circulations. Green: transport by stationary disturbances. Light brown: transport by transient disturbances. The value of solar constant used for these model runs is S =1380 W/m2.
(a) 
(b) 
Figure 2: Distribution of the meridional transport of latent heat energy (W). (a) With no filtering and with a single damping layer. (b) Experiment S1380 (filtering included in all layers, seven damping layers). Red: total transport. Blue: transport by the mean meridional circulations. Green: transport by stationary disturbances. Light brown: transport by transient disturbances. The value of solar constant used for these model runs is S=1380 W/m2.