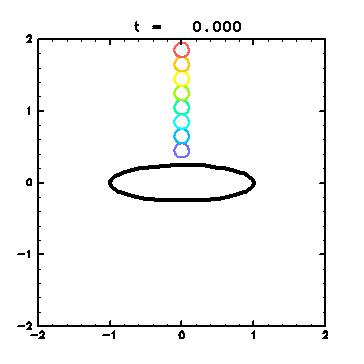
 To check the results of finite-time Lyapunov analysis in
section 4.4 ,
passive contours are advected as in section 4.3
so that stretching of fluid particles can be understood intuitively.
Initial conditions are given as follows:
Animation 3:
Advection of passive contours (GIF animation; 339kB). - As early as t = 4.0 , the yellow and green circles are stretched out, corresponding to the areas with large Lyapunov exponents in Fig. 4 . - Blue and light blue contours keep their shapes corresponding to the areas with small Lyapunov exponents. - In the co-rotating frame with the ellipse, fluids in these areas are rotating oppositely from the vortex, which visualizes the clockwise flow in Fig. 5 . |