 Animation 3:
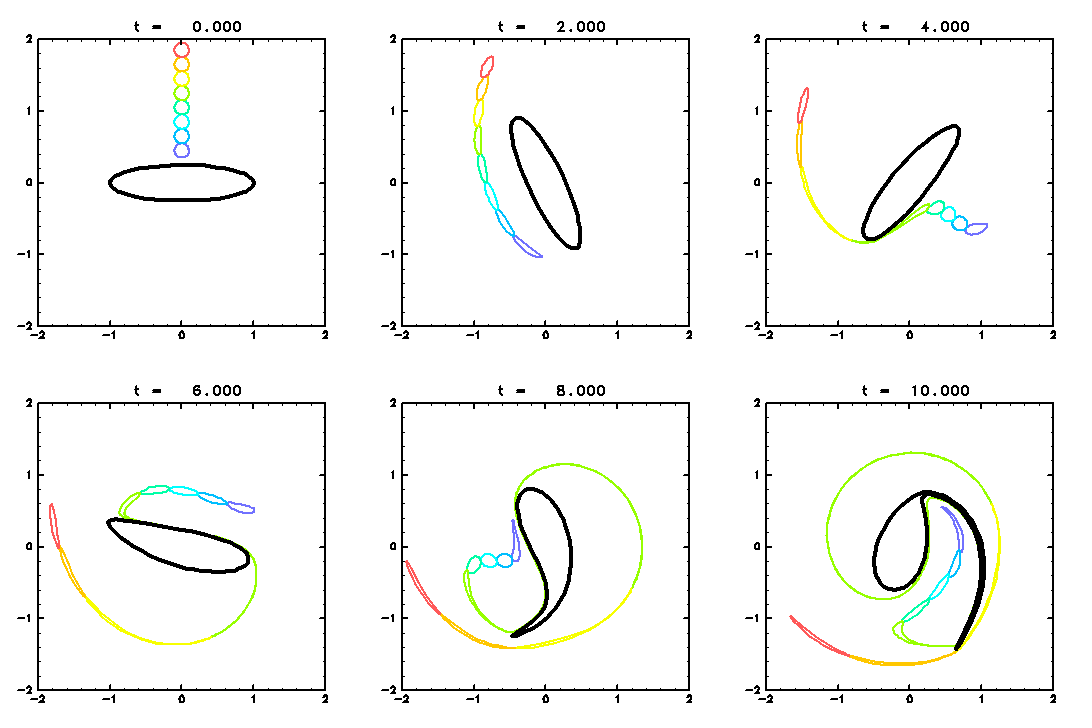
Advection of passive contours (GIF animation; 339kB).
Animation 3:
Advection of passive contours (GIF animation; 339kB).The contour positions are displayed from t = 0.0 to t = 10.0 at an interval of 0.1 . Thick line is the vortex patch. - As early as t = 4.0 , the yellow and green circles are stretched out, corresponding to the areas with large Lyapunov exponents in Fig. 4 . - Blue and light blue contours keep their shapes corresponding to the areas with small Lyapunov exponents. - In the co-rotating frame with the ellipse, fluids in these areas are rotating oppositely from the vortex, which visualizes the clockwise flow in Fig. 5 . |