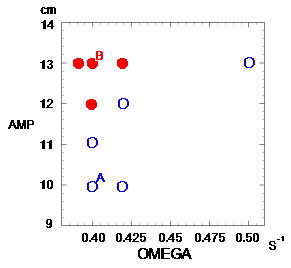
| Figure 4 Result of the QBO experiment. Vertical axis is the amplitude of the piston (cm). The horizontal axis is the frequency (s-1). Red circles indicate reversed mean flow. Blue circles indicate that the flow did not occur. Movies are made for cases A and B. |