In the present experiment, the internal gravity wave is also visualized by the moíre
method.
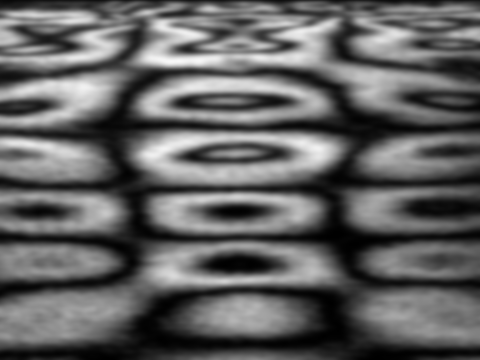
The visualized propagating wave for small wave amplitudes is shown in Figure 6. Because
the rightward and leftward waves are propagated with the same amplitude, they form a
standing wave in the horizontal direction.
The vertical phase velocity of the standing wave is upward, although the wave is
introduced at the top and propagates downward. This is because the phase velocity of the
internal gravity wave is perpendicular to the group velocity. Each component of the
standing wave has a group velocity of right down or left down, carrying energy downward,
and a phase velocity of right up or left up. Therefore, these components make a standing
wave with upward phase velocity.
Figure 6 is a series of pictures for different phases taken over several periods,
because it was impossible to visualize the wave at a shorter interval than the half period
with this visualization method.