| Measurement of Friction Coefficient on a Powder Layer and Fluid Dynamic Study |
|
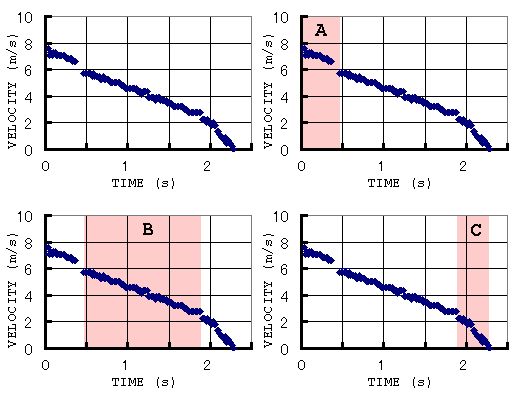
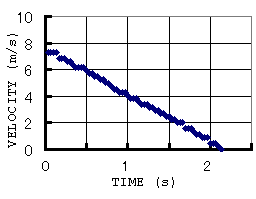
Figure 7 shows a typical example of the velocity of the disk sliding on the flour layer; the slope of this graph is equal to deceleration of the disk. Compared to a slide path without the flour layer (Fig. 8), it is seen that the deceleration rate of the disk changes on the flour layer while it is constant without the flour layer. On the powder layer, the sliding process can be divided into 3 phases according to changes in deceleration: First phase. Just after the shooting, deceleration is not constant. Second phase. In the midway of slide, deceleration remains small and constant. Third phase. Just before the halting, deceleration is large and constant. In addition, it was found that the phases and the track types described in the section of major results 1 are in synchronicity. Therefore, by combining the characteristics of these phase and trace types, we identified 3 slide phases A, B, and C. |
 Fig. 7. An example of the disk velocity on the flour layer versus time from shooting.  Fig. 8. An example of the disk velocity without the flour layer versus time from shooting. |
Other results of slide runs are shown in Appendix-5.