![]()
![]()
Results 3, Roll Structure, Top-View Animation
Now we investigate the vorticity and velocity structures of the plumes for several experiments in the 2-D regime by visualizing these quantities. The motivation is to know whether or not the all 2-D regimes are characterized by the hetons, which are quasi-stable vortex pairs. We will show two interesting structures, which are likely to be different from hetons. The first structure is roll structure observed in the experiment denoted by the blue circle in Fig. 2, and the second structure is the mushroom structure observed in the experiment denoted by the blue triangle in Fig. 2.
The iso-surface of three-dimensional vorticities,
![]() , for the roll structure viewed from the
top of the model domain is shown in Fig. 4, where
, for the roll structure viewed from the
top of the model domain is shown in Fig. 4, where ![]() is the vorticity and the subscripts indicate
the three components of the coordinates.
In order to get some idea for the direction
of the rotation, the red (blue) color is
used for the iso-surface with the positive
(negative)
is the vorticity and the subscripts indicate
the three components of the coordinates.
In order to get some idea for the direction
of the rotation, the red (blue) color is
used for the iso-surface with the positive
(negative) ![]() . In short, the positive constant value of
the three-dimensional vorticities is visualized,
but is colored in red and blue according
to the sign of the vertical component of
the vorticity.
. In short, the positive constant value of
the three-dimensional vorticities is visualized,
but is colored in red and blue according
to the sign of the vertical component of
the vorticity.
The blue colors, which indicate anticyclonic
circulation in vertical direction, forms
roll structure, whose length is of the order
of kilometers. The cyclonic circulations
shown by red color generally appear as oval-shape
of the order of hundreds of meters. The cyclonic
ovals are sometimes elongated, but their
length seldom exceeds 2 km. For the temporal
evolutions of the roll structure, an anticyclonic
roll is often connected to another roll,
and one roll breaks up into two. The view
from the bottom (not shown) is almost identical
to the view from the top, indicating that
the rolls and ovals do not overlap in the
vertical direction. The structure shown in
Fig. 4 is apparently different from the conventional
hetons (Fig. A1), which are characterized by the vortex
pairs at the top and bottom of the fluid.
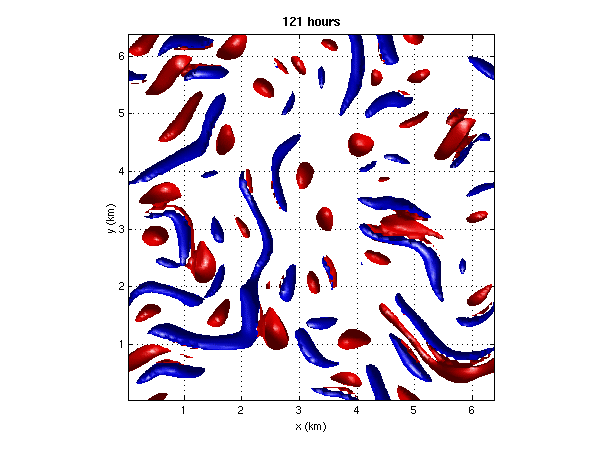
Figure 4. Animation of the vorticity surface viewed
from the top of the model domain for the
experiment shown by the blue circle in Fig. 2. The surfaces of an amplitude of 2.5*10-4s-1 for the three-dimensional vorticity are
visualized. The red color indicates that
the vertical component of the vorticity is
positive, while the blue color indicates
that the vertical component is negative.
The maximal value of the three-dimensional
vorticity with the positive vertical vorticity
is 6.4*10-4s-1, and the maximal value with the negative
vertical vorticity is 4.2*10-4s-1. The parameters for this experiment are
heat flux of 800 Wm-2,![]() =2.0*10-4s-1, and
=2.0*10-4s-1, and ![]() =3.0 m2s-1, and hence
=3.0 m2s-1, and hence ![]() =2.2*10-1and
=2.2*10-1and ![]() =1.5*104.
=1.5*104.