|
5.a. Comparison with Observation Results
|
The Viking Landers and Mars probes observed wind velocity and
atmospheric temperature at a height of 1.6 m. Because the lowest level
of the numerical model utilized in the present study is located at
about 1.5 m, a direct comparison of wind and temperature data can be
made for data at these heights. In the following, the numerical
results of our study are compared with the data of horizontal wind
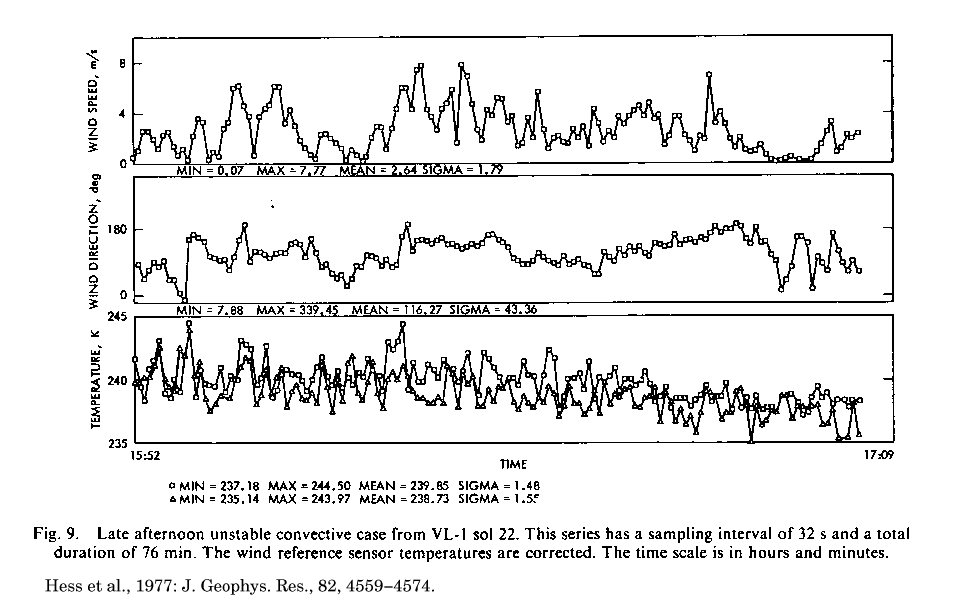
velocity and temperature of the Viking Lander 1 (see Figure 9 in
Hess et al., (1977)).
Hess et al. (1977)
argues that these data are associated with thermal convection.
Figure 15a shows time series of horizontal
wind speed, wind direction and surface temperature, as observed by
Viking Lander 1 from 15:52 to 17:09 LT on sol 22 (Ls ≈
110°). The opacity of atmospheric visible dust observed at this
time is about 0.4 (Pollack et
al., 1979), which is between the adopted value of the
dust-free case and dusty case of our numerical simulation. During the
time period in which wind velocity was observed, two components of
wind fluctuations overlap each other; one has an amplitude of about 5
m sec-1 and a period from several to tens of several
minutes, and the other has an amplitude of about 3 m sec-1
and a period from 1 to 2 minutes. In the temperature field, two
components fluctuate with time scales similar to that of wind
variations, and have magnitudes of about 3 K.
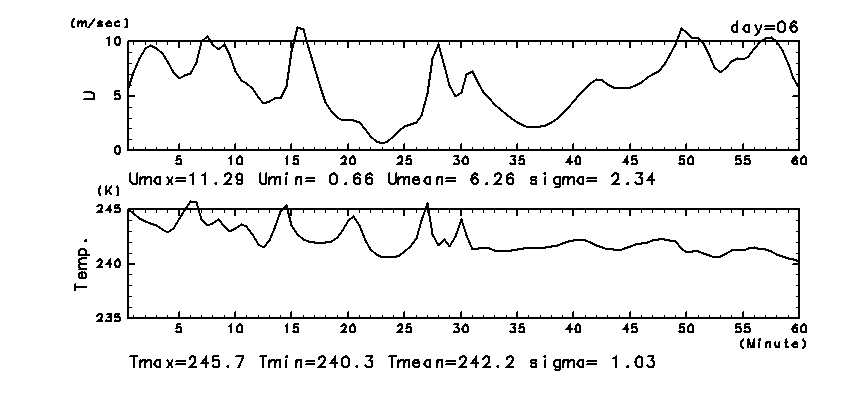
The temperature and wind fluctuations with a relatively longer time
scale in Figure 15a resemble those
simulated by our model under clear sky conditions
(Figure 15b). These fluctuations may be
associated with the passages of plumes that ascend from lower levels,
or convective circulations that occur throughout the convective
layer. On the other hand, the observed fluctuations that have a
shorter time scale do not correspond to our calculation results. They
are considered to be associated with subgrid-scale features smaller
than 100 m, such as the thermal or forced turbulence in the thermal
conduction layer or transition layer, which are parameterized in our
model. These results suggest that our numerical model successfully
represents the major features of thermal convection driven by
radiative forcing in the real Martian atmosphere, except for
small-scale turbulent structures. Conversely, the fluctuations that
occur on a time scale of a few to ten minutes in the observed data are
associated with kilometer-size thermal convection driven by radiation.
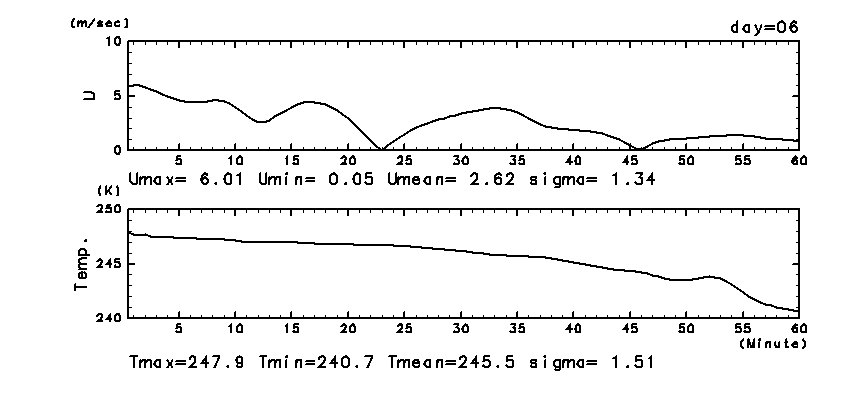
In the dusty case of our numerical simulation
(Figure 15c), no fluctuations that resemble
those of the observed data occur. One possible reason may be the
difference of atmospheric dust opacity. It is considered that the
amount of dust in our model is larger than that of the Viking
observations, and hence, the atmospheric stability is enhanced and
convective activity is suppressed. Furthermore, the activity of
thermal convection for the dusty case of our numerical simulation
almost completely diminishes by the period shown
in Figure 13.

|
|
Figure 15a: Time series of wind velocity, wind direction and
atmospheric temperature, as observed by Viking Lander 1 from 15:52 to
17:09 LT on sol 22 (Ls ≈ 110°, Figure
9, Hess et al.,
1977). The sampling time interval is 32 sec.
|

|
|
Figure 15b: Time series of wind velocity and atmospheric
temperature calculated by the 2D numerical model from 16:00 to 17:00
LT on day 6 of the dust-free case. The sampling time interval is 30
sec.
|

|
|
Figure 15c: Time series of wind velocity and atmospheric
temperature calculated by the 2D numerical model from 16:00 to 17:00
LT on day 6 of the dusty case. The sampling time interval is 30
sec. Note that, for the temperature plot, the range of the vertical
axis is different from that in Figure 15a
and Figure 15b.
|
|