|
4.c. Circulation Structure of Convection
|
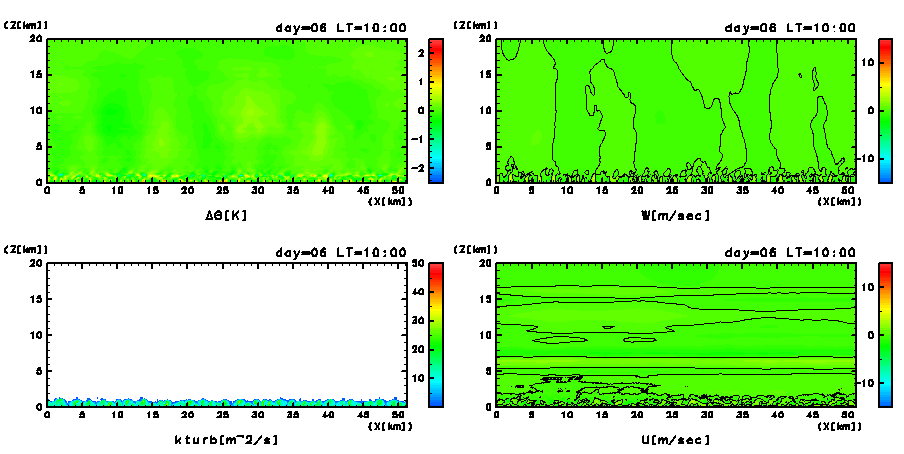
Figure 13 shows the circulation structure of
thermal convection for day 6 of the dusty case
(see Appendix D for results of a shorter
output time interval). The convective cells have vertical and
horizontal scales of about 5 km and 2 to 3 km, respectively. Thermal
convection realized under dusty conditions is kilometer in size, which
is the same for dust-free conditions. Potential temperature deviation
associated with convective plumes is 1 to 2 K, which is smaller than
that of the dust-free case (Figure 4
(left upper)).
The magnitude of vertical wind velocity is 10 to 15 m
sec-1, and that of horizontal wind velocity is about 10 m
sec-1. These values are smaller than those at similar time
periods of the dust-free case (Figure
4 (right panel)). The ratio of updraft width to downdraft width,
convective plume migration, and the method of mixing due to convective
plumes are similar to those observed in the dust-free case.
As previously stated, the magnitude of wind velocity is small compared
to that of the dust-free case. This is due to a decrease of convection
layer thickness and a decrease in the potential temperature deviation
of convective plumes. Since the length of free acceleration decreases
as convective layer thickness decreases, kinetic energy generation due
to buoyancy force decreases. Since the depth of convection
layer  and potential temperature deviation of
convective plumes and potential temperature deviation of
convective plumes  are about one half of those in the
dust-free case, the magnitude of wind velocity estimated by Equation
(1) is also one half of that of
the dust-free case (about 10 m sec-1). The deviation of
potential temperature associated with convective plumes can be
estimated by using Equation (5); the
details are shown in Section 4.c.i. are about one half of those in the
dust-free case, the magnitude of wind velocity estimated by Equation
(1) is also one half of that of
the dust-free case (about 10 m sec-1). The deviation of
potential temperature associated with convective plumes can be
estimated by using Equation (5); the
details are shown in Section 4.c.i.
|