

| 4. Results with moist convective adjustment scheme | [prev] [index] [next] |
In the previous subsection, we observed that, also in the experiment with moist adjustment scheme, precipitation activity along the equator responds systematically to the change of the vertical profile of radiative cooling, although the change is relatively weak compared to that with Kuo scheme.
In this subsection, we examine the circulation structure and time evolution of the grid scale precipitation events, in the similar fashion as the experiment with Kuo scheme (subsection 3.3), by observing time series of data with the higher temporal resolution (2 hours) and animation of them. We select cases adj-a and adj-c among the four cases as the representatives of lower level cooling and upper level cooling cases, respectively, and present precipitation, specific humidity, and circulation fields.
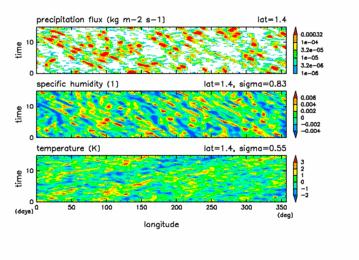
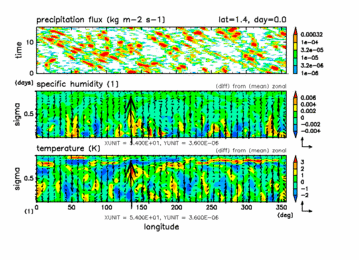
Fig.4.6 shows the time developments of precipitation, specific humidity, temperature and wind fields along the equator of the upper level cooling experiment (case adj-c). As is seen in the experimet with Kuo scheme (Fig.3.6), a notable feature directly corresponding to the grid scale precipitation activity is an existence of grid scale strong upward motion. (middle and lower right panels of Fig.4.6; movie). The intensity of upward motion is fairly larger than that for the case with Kuo scheme (Fig.3.6movie). A noteworthy character is that individual vertical motion associated with each of the precipitation events exhibits a distinct "life-cycle"; it begins with a relatively weak upward motion in the lower troposphere, followed by an upward development with increasing magnitude, and, after that, the low level motion reverses its sign to downward and the upward motion in the upper troposphere weakens, and then, terminates.
As is in the case with Kuo scheme, humidity anomaly (middle panels of Fig.4.6). is dominated by the grid-scale feature that moves westward at the same speed as that of the grid-scale precipitation activity. This contrasts with the temperature field (lower panels of Fig.4.6) where eastward signals are also evident. The life-cycle of individual precipitation activity can be identified also in the humidity anomaly (middle panels of Fig.4.6 movie). The low level upward motion begins at a region of the larger specific humidity, and the moist region develops upward as the upward extension of the upward motion, followed by an emergence of a lower specific humidity region in lower troposphere as the downward motion develops in the lower levels. The structure and evolution of the temperature anomaly is more complicated (lower panels of Fig.4.6). In the mature phase of the precipitation event, we can recognize that the signature of the temperature anomaly seems to be positive in the upper levels and is negative in the lower levels.
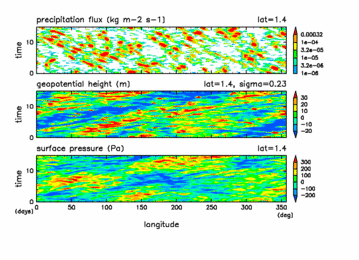
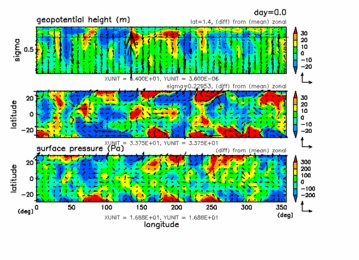
Fig.4.7 shows the time developments of height and surface pressure fields along or around the equator of the upper level cooling experiment (case adj-c). Violent variations corresponding to the grid-scale vertical motions are notable in the horizontal fields. Correspondingly, horizontal wind anomaly seems to be dominated by convergence in the lower levels and by divergence in the upper levels at the locations of upward motion. However, it is difficult to figure out some relationship between the circulation anomaly and equatorial wave dynamics from Fig.3.4. We will discuss the details by the use of composite analysis in (subsection 4.4. One of the characteristics of height and surface pressure fields is, as is the case with Kuo scheme, that signals with planetary scales become evident. We can observe large scale signals with the period longer than 10 days, especially anomaly with wavenumber one (middle left and lower left panels of Fig.4.7). These planetary scale and long period disturbances seem to have a structure similar to equatorial Kelvin waves, where east-west wind dominates, although the Kevlin wave like nature is less recognizable compared to the case with Kuo scheme.
Fig.4.8 and Fig.4.9 show the time developments of precipitation, specific humidity, temperature and circulation fields along or around the equator of the lower level cooling experiment (case adj-a). The structure and time development of disturbances associated with the grid-scale precipitation activity in the lower level cooling experiment (adj-a) do not differ qualitatively from those in the upper level cooling experiment (adj-c), although magnitudes of anomalies are decreased in this lower level cooling experiment (adj-a). In contrast to the experiment with Kuo scheme, the experiment with moist convective adjustment scheme show that the structures of equatorial precipitation and associated circulation anomaly are less sensitive to the change of vertical structure of radiative cooling. The reason for this small sensitivity can be attributed to the the likewise small sensitivity of the vertical profile of condensation heating (right panel of Fig.4.1) compared to that with Kuo scheme (right panel of Fig.3.1). In the upper level cooling experiment with moist adjustment scheme, for instance, the difference of condensation heating in the upper and the lower layers is fairly smaller than that with Kuo scheme, and consequently the condensation heating profile is not very different from that in the lower level cooling experiment. However, the reason why the condensation profile shows little dependence has not been clarified.
| [prev] [index] [next] |