F. Atmospheric Structure in the Runaway Greenhouse State |
Meridional Distribution of Specific Humidity in the Runaway Greenhouse State (Animation)
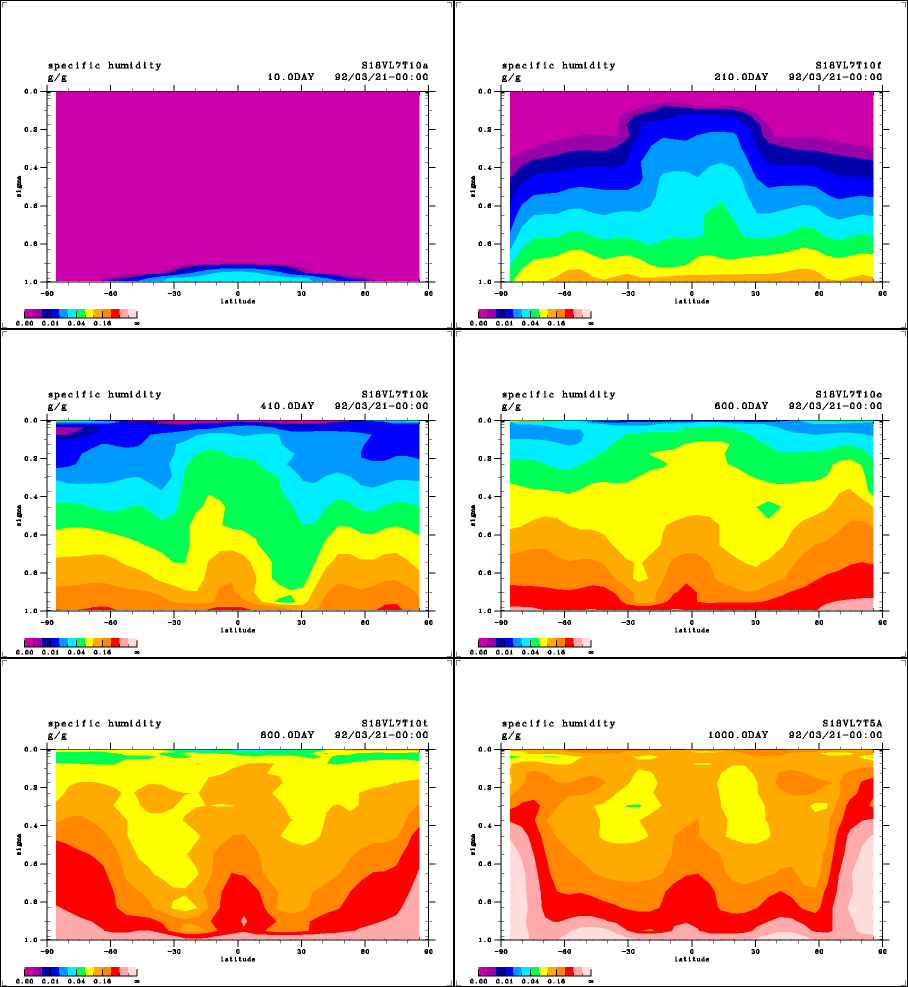
Animation 1 below illustrates the time evolution of the zonal mean specific humidity distribution in the troposphere. As the water vapor content increases across the globe, the meridional water vapor content difference decreases. After Day 400, an increase in the water vapor content is evident in the polar regions. This increase can probably be explained by the phenomenon that water vapor that originated from evaporation of liquid water around 30° latitude north and south is transported to high latitudes and accumulates in the polar regions.

Animation 1: Time evolution of the meridional specific humidity distribution (kg/kg) in Experiment S1800.