F. Atmospheric Structure in the Runaway Greenhouse State |
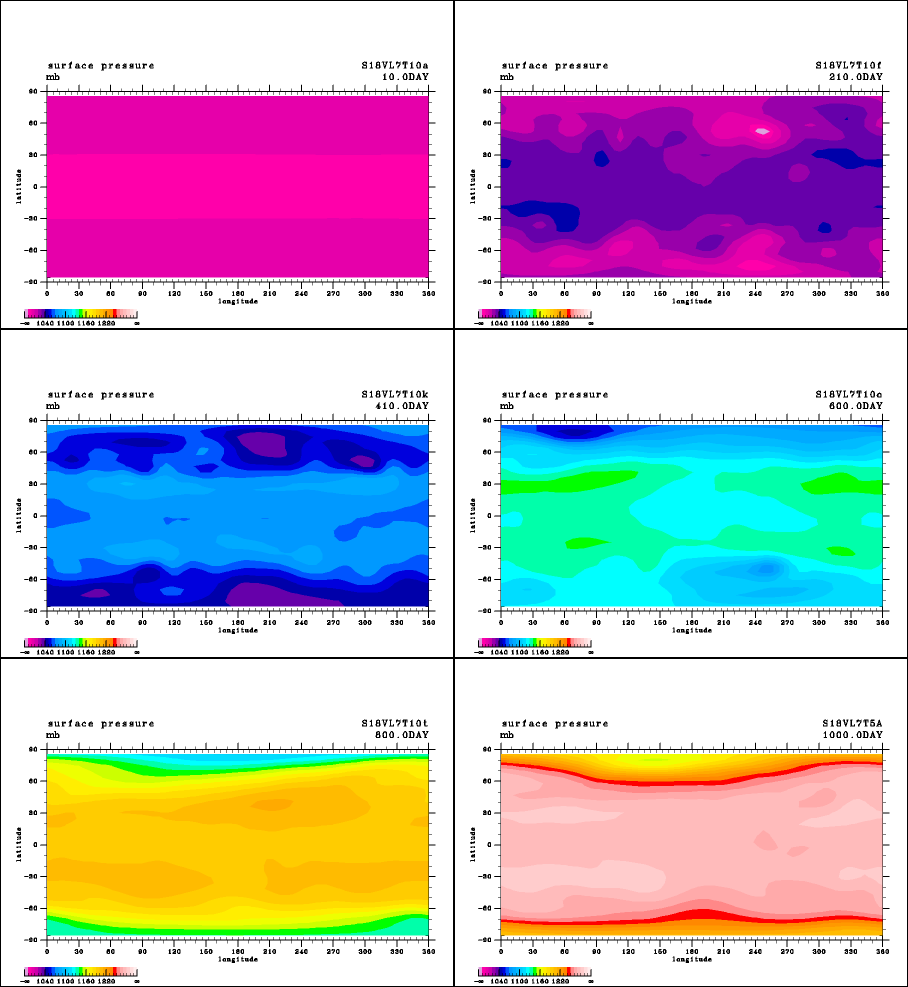
Surface Pressure Distribution in the Runaway Greenhouse State (Animation)
The time evolution of surface pressure in Experiment S1800 is illustrated below. Surface pressure is the highest near 30° latitude north and south.

Animation 1: Time evolution of the surface pressure distribution (Pa) in Experiment S1800.