F. Atmospheric Structure ins the Runaway Greenhouse State |
F. Atmospheric Structure ins the Runaway Greenhouse State |
Surface Temperature Distribution in the Runaway Greenhouse State (Animation)
The time evolution of surface temperature in Experiment S1800 is illustrated below. Surface temperature increases across the globe with time. Starting on Day 800, the maximum values of surface temperature occur at mid-latitudes.
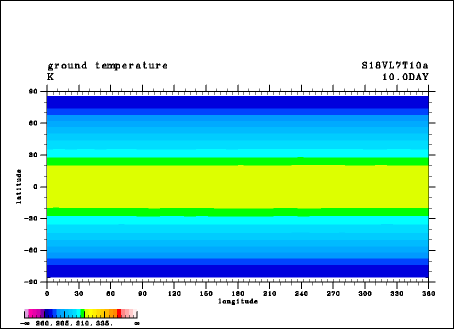
Animation 1:Time evolution of the surface temperature distribution (K) in Experiment S1800.
| F. Surface Temperature Distribution in the Runaway Greenhouse State (Animation) |