3.1 Overview of the Time Evolution of the Vorticity Field and the Zonal-Mean Zonal Flow
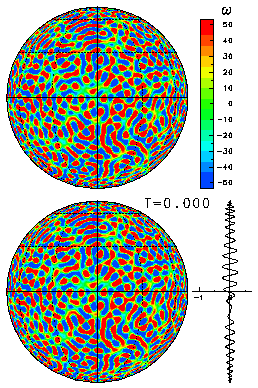
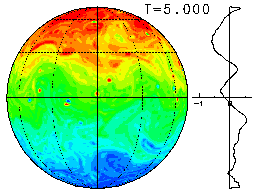
We present an overview of the time evolution of the flow field in real space by showing the changes of the vorticity field and the zonal-mean zonal flow. The figure on the right shows (one example of) the initial value as a field of vorticity ω.
The initial parameters are n0 = 50 and γ = 1000, and the truncation wavenumber is T341.
Here, the colors red and blue denote areas of positive and negative vorticity, respectively. In addition, the zonal-mean angular momentum (u cosφ) is shown to the right of the plot.
The visual representation of the vorticity field is an orthographic projection(equatorial aspect) and the latitude and longitude are drawn for every 30 degrees.
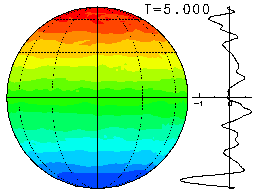
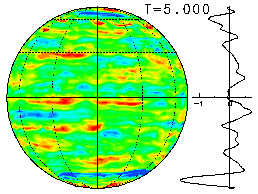
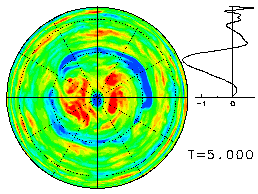
The time evolutions for three values of Ω (=0, 50, 400) started from the same initial values are shown below. The plots below show the final state for each value of Ω. Click on the plots to view the animation of the time evolution from the initial state.
Since the figures below show the field of absolute vorticity q = ω + 2Ωμ, please note that the effect of planetary vorticity (2Ωμ) adds the NS gradient to the relative vorticity field when Ω ≠ 0.

