3.2 Generation of easterly polar vortex

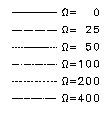
Time evolution was carried out for 18 combinations created from 3 different initial parameters (n0 = 10, 50, and 100) and 6 different rotational angular velocity of sphere (Ω = 0, 25, 50, 100, 200, and 400), and for each combination, calculations were made for 10 different random initial values. The figures below plot the ensemble mean of the final states (t = 5) of the zonal-mean angular momentum of time evolution with the distribution of the southern hemisphere folded over and superimposed on the northern hemisphere. (In other words, we have taken the pseudo ensemble mean for 20 random initial values.)
The other parameters were the same, at γ = 1000 and T341. Note that the distribution curves for each Ω are distinguishable by the line type. (See legend on right.)
