Results
Now,
we examine the effectiveness of the ensemble experiment
in noise reduction by increasing the size of ensemble.
In the followings, we will show the
time-longitude cross sections of precipitation and surface
pressure at the equator.
Ensemble Mean Precipitation
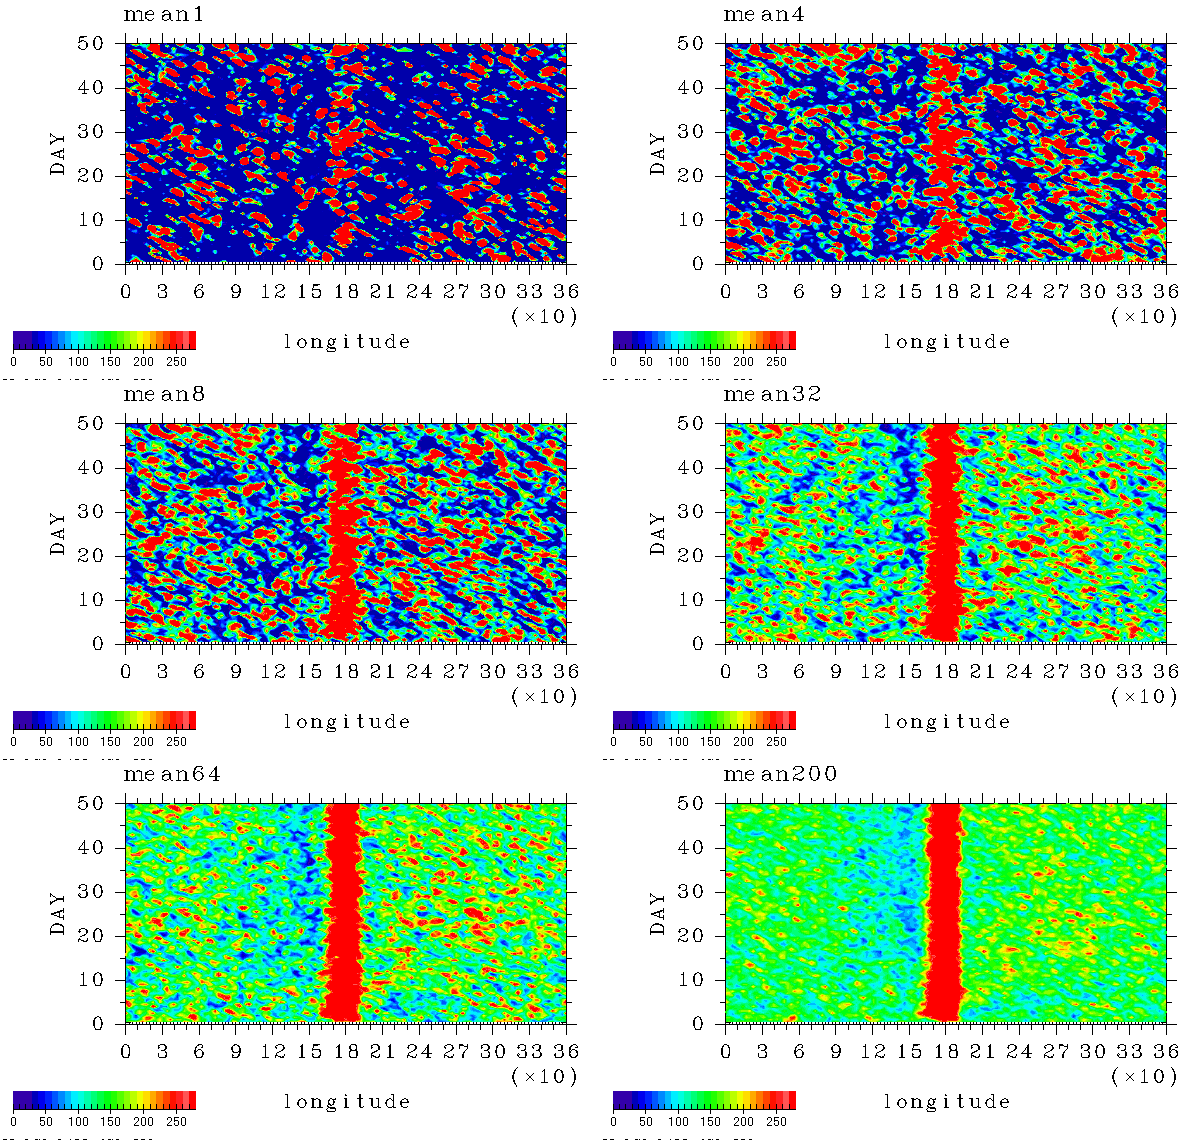
Figure 3 (animation)
shows the change of the time-longitude cross section
of precipitation at the equator
by increasing the size of ensemble set.
 Figure 3: Time-longitude cross section of
precipitation at the equator (W/m2).
The change is shown as an animation
with increasing the size of ensemble set
as 1, 2, 4, 8, 16, 32, 64, 128, and 200.
The unit of time axis is day with day 0 as the onset day of
the warm SST area.
(Please use the reload button of your browser to restart the animation.)
As the increase of the seize of ensemble set,
there appear the following characteristics.
These characteristics become clearer with the increase of
the ensemble size.
-
1 run
-
There appears only a tendency of precipitation
accumulation over the warm SST area (located at 180E).
No feature of east-west asymmetry can be observed.
-
2 run mean
-
4 run mean
-
8 run mean
-
By carefully examining the ratio between the blue and red
colored areas,
one can recognize that,
from around day 15 after the introduction of the warm SST area,
precipitation decreases to the west, while
it increases to the east of the warm SST area.
-
16 run mean
-
32 run mean
-
One can recognize
a decrease of precipitation to the east
of the warm SST area occurring
at around day 5 to 10
soon after the switch-on.
The increase of precipitation occurs after
this decrease.
The beginning date of precipitation decrease is delayed as
one moves away from the warm SST area.
-
64 run mean
-
As the size of ensemble set is increased,
the characteristics mentioned above become clearer.
-
128 run mean
-
200 run mean
The ensemble mean operation with the size of larger than 32
reproduces the tendency that
the precipitation increase (decrease) occurs to the east (west)
of the warm SST area.
This is the characteristics of precipitation
shown by
Hosaka
et al. (1998)
with the long term mean data.
The ensemble mean operation revealed that this characteristics establishes
about 15 days after the switch-on of the warm SST area.
The ensemble experiment also revealed that,
to the east of the warm SST area,
the increase of precipitation occurs after it once decreases.
The important point is that this temporal decrease of
precipitation emerges in the form of an eastward propagating
disturbance.
 Figure 3: Time-longitude cross section of
precipitation at the equator (W/m2).
The change is shown as an animation
with increasing the size of ensemble set
as 1, 2, 4, 8, 16, 32, 64, 128, and 200.
The unit of time axis is day with day 0 as the onset day of
the warm SST area.
(Please use the reload button of your browser to restart the animation.)