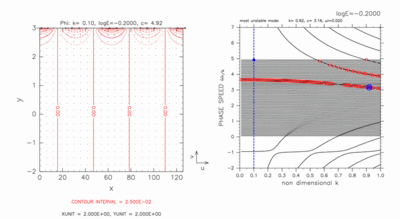
The structures of the continuous modes for log E=-0.20 are
described in section 3.3.
In this section, results for various values of E
are presented in order to examine the structural change of continuous
modes according to phase speed.
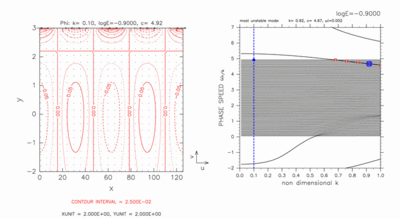
An animation of structural change of continuous modes for log
E=-0.90 is shown in figure A-1.
Below is descriptions of horizontal structures
of the continuous modes for various phase speed.
- 4.67 ≤ c ≤ 4.92 :
The structure of a continuous mode exists around y=3.00.
An equatorial Kelvin wave like structure exists around
y=0.00.
- 3.32 ≤ c ≤ 4.59 :
A north boundary Kelvin wave like structure exists around
y=3.00.
The structure of a continuous mode exists on the south of a
north boundary Kelvin wave like structure.
An equatorial Kelvin wave like structure exists around
y=0.00.
- 2.45 ≤ c ≤ 3.24 :
The structure of a north boundary Kelvin mode exists around
y=3.00.
The structure of a continuous mode exists on the south of
the structure of north boundary Kelvin mode.
An equatorial Kelvin wave like structure also seems to appear around
y=0.00, though its amplitude is small.
- 1.37 ≤ c ≤ 2.37 :
The structure of a north boundary Kelvin mode exists around
y=3.00.
There exists an equatorial Rossby wave like eddy structure
in the velocity field around y=0.80,
though its amplitude is small.
The structure of a continuous mode cannot be observed.
- c ≤ 1.30 :
The structure of a north boundary Kelvin mode exists around
north boundary.
An equatorial Rossby wave like structure exists on the north
of the equator
(A part of the equatorial Rossby wave like structure
is superimposed on the structure of a north boundary Kelvin mode).
The structure of a continuous mode exists on the south of the equator,
though its amplitude is small.
Figure A-1:
Horizontal structure of a continuous mode for
log E=-0.90, k=0.10 (left panel).
The position of the mode in dispersion curves is indicated by a blue
filled circle in the right panel.
Click the figure to show animation of horizontal structures of
continuous modes scanned at k=0.10.
Symbols in the right panel are same as table 1.
An animation of structural change of continuous modes for
log E=-0.20 is shown in figure A-2.
Structural change of the modes in this case
is described in section 3.3.
Figure A-2:
Same as figure A-1, but for log E=-0.20, k=0.10.
A decay mode with k=0.10, c=3.65
is not included in the animation.
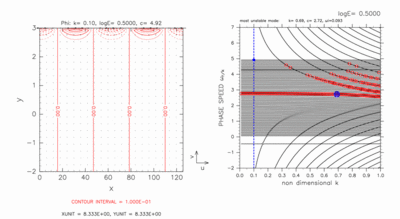
An animation of structural change of continuous modes for
log E=0.50 is shown in figure A-3.
Below is descriptions of horizontal structures
of the continuous modes for various phase speed.
- 4.76 ≤ c ≤ 4.92 :
The structure of a continuous mode exists around y=3.00.
- 4.36 ≤ c ≤ 4.68 :
A north boundary Kelvin wave like structure exists around
y=3.00.
The structure of a continuous mode exists on the south of a north
boundary Kelvin wave like structure.
- c=4.30 :
The structure of a north boundary Kelvin mode exists around
y=3.00.
The structure of a continuous mode cannot be observed.
- 3.80 ≤ c ≤ 4.27 :
The structure of north boundary Kelvin mode exists around
y=3.00.
The structure of a continuous mode exists on the south of the structure
of a north boundary Kelvin mode.
- 3.64 ≤ c ≤ 3.72 :
The structure of a continuous mode exists around y=2.00.
- 2.99 ≤ c ≤ 3.56 :
The structure of a continuous mode exists around y=1.50.
An equatorial Kelvin wave like structure exists around
y=0.00.
- 2.81 ≤ c ≤ 2.90 :
An equatorial Kelvin wave like structure exists around y=0.00.
The structure of a continuous mode cannot be observed.
- c=2.77 :
In this case, equatorial Kelvin modes and continuous modes resonate.
An animation includes a figure of unstable mode for c=2.77,
but not a decay mode.
For both of an unstable mode and a decay mode,
equatorial Kelvin wave like structures exist
around y=0.00 (figure not shown for decay mode).
The structure of continuous modes cannot be observed.
Equatorial Rossby wave like structures exist around y=1.20.
- 1.72 ≤ c ≤ 2.71 :
An equatorial Rossby wave like structure exists around y=1.20.
An equatorial Kelvin wave like structure exists around
y=0.00.
The structure of a continuous mode cannot be observed.
- c ≤ 1.64 :
An equatorial Rossby wave like structure exists around y=1.20.
An equatorial Kelvin wave like structure exists around
y=0.00.
These structures are decayed with decrease of phase speed.
The structure of continuous mode exists on the south of
an equatorial Kelvin wave like structure.
The structure of continuous mode
gradually approaches y=-2.00
with decrease of phase speed.
Figure A-3:
Same as figure A-1, but for log E=0.50, k=0.10.
A decay mode with k=0.10, c=2.77
is not included in the animation.
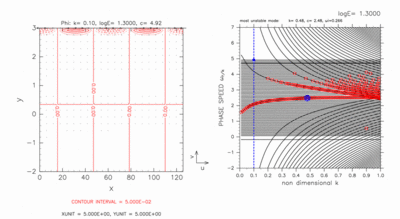
An animation of structural change of continuous modes for
log E=1.30 is shown in figure A-4.
Below is descriptions of horizontal structures
of the continuous modes for various phase speed.
- 4.84 ≤ c ≤ 4.92 :
The structure of a continuous mode exists around y=3.00.
- c=4.76 :
The structure of a north boundary Kelvin mode exists around
y=3.00.
The structure of a continuous mode exists on the south of the structure
of a north boundary Kelvin mode.
- c=4.72 :
The structure of a north boundary Kelvin mode exists around
y=3.00.
The structure of a continuous mode cannot be observed.
- c=4.68 :
A north boundary Kelvin wave like structure exists around
y=3.00.
The structure of a continuous mode exists on the south of a north
boundary Kelvin wave like structure.
- 4.21 ≤ c ≤ 4.60 :
The structure of a continuous mode exists in 2.00 ≤
y ≤ 3.00.
- c=4.19 :
The structure of an eastward mixed Rossby-gravity mode exists.
The structure of a continuous mode cannot be observed.
- 2.84 ≤ c ≤ 4.13 :
The structure of continuous mode exists in the north of the domain.
An eastward mixed Rossby-gravity wave like structure
exists on the south of the structure of a continuous mode.
An equatorial Kelvin wave like structure is observed around the
equator, though amplitude of the mode is small for large c.
Equatorial Kelvin wave like structure at y=0.00
are dominant
with decrease of phase speed.
- 2.51 ≤ c ≤ 2.75 :
An eastward mixed Rossby-gravity wave like structure exists in the
north of the domain.
The structure of a continuous mode exists on the south of an eastward mixed
Rossby-gravity wave like structure.
An equatorial Kelvin wave like structure exists at y=0.00.
- 2.10 ≤ c ≤ 2.42 :
An equatorial Rossby wave like structure is observed
in the north of the domain, though the amplitude is small.
An equatorial Kelvin wave like structure exists on the south of the
equatorial Rossby wave like structure.
The structure of continuous mode cannot be observed.
- c=2.09 :
In this case, equatorial Kelvin modes and westward mixed
Rossby-gravity modes resonate.
An animation includes a figure of unstable mode for c=2.09,
but not a decay mode.
For both of an unstable mode and a decay mode,
equatorial Kelvin wave like structures exist
around y=0.00 (figure not shown for decay mode).
The structure of continuous modes cannot be observed.
- 1.40 ≤ c ≤ 2.02 :
An equatorial Rossby wave like structure is observed in the north of
the domain.
An equatorial Kelvin wave like structure exist on the south of the
equatorial Rossby wave like structure.
Although the structure of a continuous mode cannot be observed for
larger value of c, it gradually appears on the south with the
decrease of c.
There is a possibility that
structures of westward mixed Rossby-gravity modes assimilate into
the modes.
However,
only with figure A-4, it is not confirmed that
structures of westward mixed Rossby-gravity modes
emerge in the horizontal structure
of the continuous modes.
- c ≤ 1.33 :
Only the structure of continuous mode can be observed.
Their structures gradually move southward with the decrease of c.
Figure A-4:
Same as figure A-1, but for log E=1.30, k=0.10.
A decay mode with k=0.10, c=2.09
is not included in the animation.


