In section 5.2,
it is discussed that
the existence of computational domain
outside the inertially unstable region causes
crossing modes.
In this section,
with a series of results
in which computational domains
are enlarged gradually from the case only with the inertially unstable
region,
it is shown that the number of crossing modes
increases with enlarging the meridional extent
of the computational domain.
Table B-1 is a
summary of the number of crossing modes
for various meridional width of the computational domain.
Figure shown in each case is dispersion curves
for log E=7.50.
Under this value of E,
there exist only the dispersion curves of crossing modes
outside of dispersion curves of continuous modes.
Adding a grid point outside the inertially unstable region
0 ≤ y ≤ 1
causes an eastward crossing mode, an westward crossing mode, and
a continuous mode.
Table B-1:
Summary of the number of crossing modes
for various meridional width of the computational domain.
Left column shows a series of results in which computational domains
are enlarged northward from the case with 0 ≤ y ≤ 1.
Right column shows a series of results in which computational domains
are enlarged southward from the case with 0 ≤ y ≤ 1.
Figure shown in each case is dispersion curves
for log E=7.50.
Click the figure to show a larger figure.
Click [Animation] to show dispersion curves
for various values of E .
Domain size
Number of grid
Animation figure (link) | Number of
crossing modes | Dispersion curves
(log E=7.50) |
+0.00 < y < +1.00
(number of grid: 13)
[Animation]
| eastward: 0 | 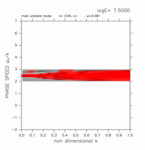 |
| westward: 0 |
+0.00 < y < +1.20
(number of grid: 16)
[Animation] | eastward: 2 | 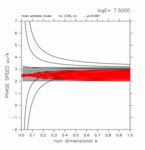 |
| westward: 2 |
+0.00 < y < +1.40
(number of grid: 19)
[Animation] | eastward: 5 | 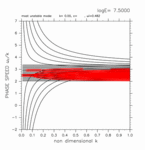 |
| westward: 5 |
+0.00 < y < +1.60
(number of grid: 22)
[Animation] | eastward: 8 | 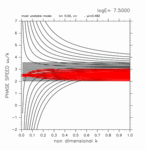 |
| westward: 8 |
+0.00 < y < +1.80
(number of grid: 25)
[Animation] | eastward: 11 | 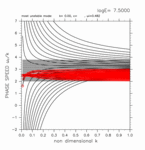 |
| westward: 11 |
+0.00 < y < +2.00
(number of grid: 28)
[Animation] | eastward: 14 | 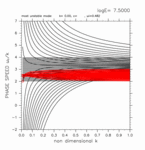 |
| westward: 14 |
+0.00 < y < +2.20
(number of grid: 31)
[Animation] | eastward: 16 | 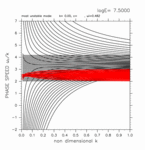 |
| westward: 16 |
+0.00 < y < +2.40
(number of grid: 34)
[Animation] | eastward: 19 | 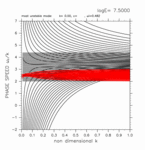 |
| westward: 19 |
+0.00 < y < +2.60
(number of grid: 37)
[Animation] | eastward: 22 | 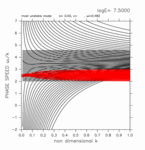 |
| westward: 22 |
+0.00 < y < +2.80
(number of grid: 40)
[Animation] | eastward: 25 | 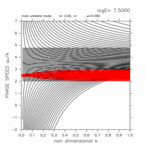 |
| westward: 25 |
+0.00 < y < +3.00
(number of grid: 43)
[Animation] | eastward: 28 | 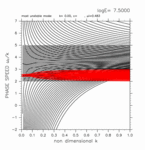 |
| westward: 28 |
|
Domain size
Number of grid
Animation figure (link) | Number of
crossing modes | Dispersion curves
(log E=7.50) |
+0.00 < y < +1.00
(number of grid: 13)
[Animation] | eastward: 0 |  |
| westward: 0 |
-0.20 < y < +1.00
(number of grid: 16)
[Animation] | eastward: 2 | 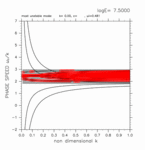 |
| westward: 2 |
-0.40 < y < +1.00
(number of grid: 19)
[Animation] | eastward: 5 | 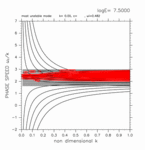 |
| westward: 5 |
-0.60 < y < +1.00
(number of grid: 22)
[Animation] | eastward: 8 | 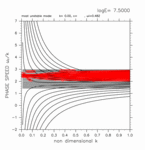 |
| westward: 8 |
-0.80 < y < +1.00
(number of grid: 25)
[Animation] | eastward: 11 | 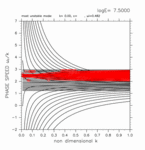 |
| westward: 11 |
-1.00 < y < +1.00
(number of grid: 28)
[Animation] | eastward: 13 | 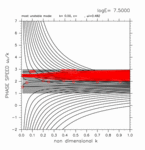 |
| westward: 13 |
-1.20 < y < +1.00
(number of grid: 31)
[Animation] | eastward: 16 | 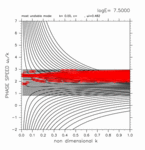 |
| westward: 16 |
-1.40 < y < +1.00
(number of grid: 34)
[Animation] | eastward: 19 | 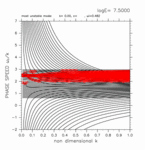 |
| westward: 19 |
-1.60 < y < +1.00
(number of grid: 37)
[Animation] | eastward: 22 | 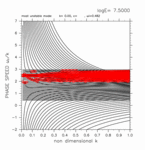 |
| westward: 22 |
-1.80 < y < +1.00
(number of grid: 40)
[Animation] | eastward: 25 | 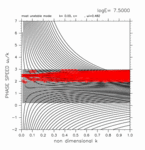 |
| westward: 25 |
-2.00 < y < +1.00
(number of grid: 43)
[Animation] | eastward: 28 | 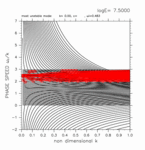 |
| westward: 28 |
|