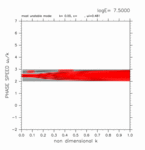
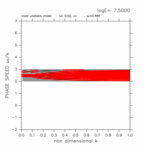
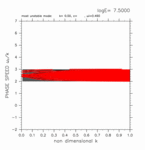
As described in section 5.2, crossing modes do not appear for the cases with only the inertially unstable region regardless the number of grid points. Figure C-1 shows dispersion curves for the cases in which the computational domains are fixed as (0 ≤ y ≤ 1) but the numbers of grid points are changed. In all cases shown in figure C-1, no crossing mode emerges even when the values of E are increased.
 |
 |
 |
Figure C-1: Dispersion curves for the cases whose computational domains are 0 ≤ y ≤ 1 (inertially unstable region). Numbers of grids changes as 13, 16, and 26 from the left figure to right one. Click each figure to show animations of dispersion curves with changing the value of E.