Equatorial Rossby modes do not appear explicitly in the results of TI2006. The dispersion curves of equatorial Rossby modes cannot be identified in the figures of table 1 or dispersion curves for various E (animation). TI2006 speculated that all equatorial Rossby modes assimilate into continuous modes. However, horizontal structures of continuous modes with which equatorial Rossby modes assimilate were not shown. In this section, structures of continuous modes are examined for the same calculation as TI2006. It is confirmed that some continuous modes have equatorial Rossby wave like structures. The calculation domain is -2.00 ≤ y ≤ 3.00.
A detailed examination of horizontal structures of continuous modes shows that there exist some continuous modes which have structures similar to equatorial Rossby waves. An example is shown in figure 2. The left panel of figure 2 shows the horizontal structure of continuous mode with c=1.48. The position of the mode in dispersion curves is indicated by a blue filled circle in the right panel of figure 2. Continuous modes have their amplitude peaks at critical latitudes (latitude at which basic flow velocity equals phase velocity of the mode). Actually, in the left panel of figure 2, amplitude peak of geopotential exists at y=-0.52, nearly the critical latitudes. Besides the peak at critical latitude, another amplitude peak of geopotential exists around at y=1.50, which suggests assimilation of a mode other than continuous mode. The assimilated mode is considered to be an equatorial Rossby mode. According to dispersion curves (the right panel of figure 2), dispersion curve of continuous modes indicated by a blue filled circle exists between dispersion curves of equatorial Kelvin mode and westward mixed Rossby-gravity mode. The candidate for the assimilated mode is only equatorial Rossby mode. Mode structure near y=1.50 shown in the left panel of figure 2 is consistent with the structure of equatorial Rossby mode. Therefore, continuous mode shown in figure 2 can be considered to be assimilated with equatorial Rossby mode.
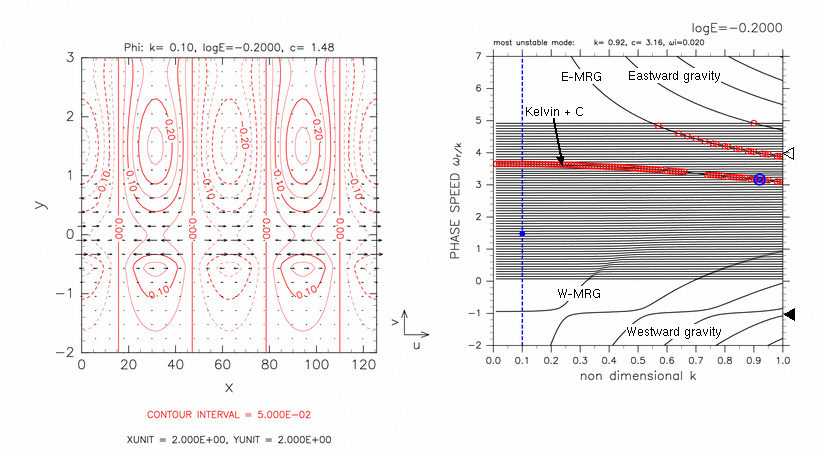
Figure 2: A continuous mode that has Rossby wave like structure. (Left) Horizontal structure of geopotential φ (contours) and velocity field (vectors) of a continuous mode with log E=-0.20, k=0.10, c=1.48. Contour intervals are 5.00 × 10⁻². Dashed contours correspond to negative values. (Right) Dispersion curves for log E=-0.20. A blue filled circle indicates the continuous modes shown in left panel. The label 'Kelvin + C' indicates unstable modes caused by resonance between equatorial Kelvin modes and continuous modes. Other symbols in the right panel are same as table 1.
The characteristics of equatorial Rossby waves emerge only in the range of 0 ≤ c ≤ 2.5. This is confirmed by scanning structures of continuous modes at a fixed k. The results are shown in figure 3. The structures of continuous modes change according to the value of c as described in ■ and ■ of figure 3. In the cases that values of phase speed of continuous modes are smaller than 2.5, basic flow speed at the dynamic equator (three regions indicated by ■ and ■ from bottom), equatorial Rossby wave like structures emerge. For the other values of E not shown in figure 3, there exist continuous modes that have equatorial Rossby wave like structures (Appendix A).
Figure 3: Summary of horizontal structures of continuous modes for log E=-0.20, k=0.10. Characteristics of horizontal structures of continuous modes in the regions indicated by red and blue arrows in the right panel are described in ■ and ■. Characters "C", "N.B.K.", "K", and "Rossby" indicate continuous modes, north boundary Kelvin modes, equatorial Kelvin modes, and equatorial Rossby modes, respectively. Symbols in the right panel are same as table 1. Click ■ and ■ to show typical structures of continuous modes for corresponding regions. Click [Animation] to show horizontal structures of continuous modes scanned at k=0.10.