TI2006 tries to identify dispersion curves of resonating equatorial Kelvin modes and mixed Rossby-gravity modes by the use of three methods: (1) derivation of approximate dispersion relation of equatorial Kelvin wave, (2) elimination of dispersion curves of continuous modes with distorting basic flow (application of the discussion by Iga, 1999c), and (3) derivation of approximate dispersion relation of equatorial waves by the use of the uniform Γ-plane approximation (Boyd and Christdis, 1982). However, positions and behaviors of dispersion curves of these modes can not be identified clearly for larger value of E because their dispersion curves are superimposed on dispersion curves of other unstable modes.
For the calculational domain 0 < y < 1 used in section 5, the range of phase speed of continuous modes is narrower than that of TI2006. Dispersion curves of unstable modes caused by resonance between equatorial Kelvin modes and continuous modes, and mixed Rossby-gravity modes can be observed clearly. In this section, with calculational domain of 0 < y < 1, behaviors of the dispersion curves of equatorial Kelvin modes and westward mixed Rossby-gravity modes are examined for the case when their dispersion curves are close. The results for other calculational domains are shown in Appendix B.
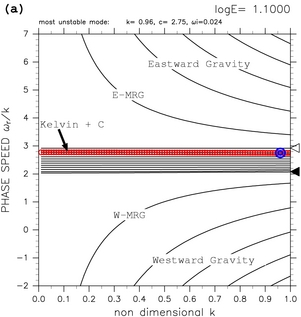
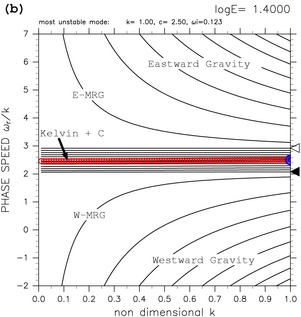
In the case with calculational domain of 0 < y < 1 for log E < 1.50 (figures 9a and 9b), phase speed of unstable modes caused by resonance between equatorial Kelvin modes and continuous modes approaches c=2.5 (the velocity of basic flow at the dynamic equator) with the increase of the value of E. This result is consistent with the discussion of Clark and Haynes (1996) who obtained approximate dispersion curves of modes in equatorial shear flow with asymptotic expansion. The asymptotical behavior of phase speed of the unstable modes cannot be confirmed clearly with the dispersion curves obtained by TI2006.
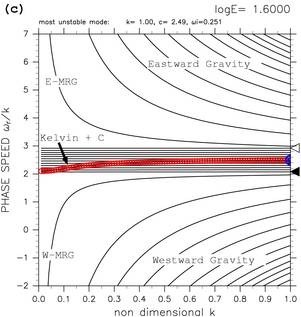
For larger values of E (figures 9c and 9d), equatorial Kelvin modes and westward mixed Rossby-gravity modes resonate. In the results of TI2006 (their figure 6f), it seems that the dispersion curve of unstable modes caused by resonance between equatorial Kelvin modes and continuous modes kinks just before equatorial Kelvin modes resonate with westward mixed Rossby-gravity modes. In the figures obtained by TI2006, the details of the behavior of dispersion curves of unstable modes caused by equatorial Kelvin modes and continuous modes cannot be observed, since the dispersion curves of the unstable modes are thoroughly buried among other dispersion curves. For the case with calculational domain of 0 < y < 1, kink of dispersion curves of unstable modes caused by resonance between equatorial Kelvin modes and continuous modes can be clearly observed (figures 9c and 9d. see also an animation figure for 1.50 ≤ log E ≤ 2.50). Dispersion curves of the unstable modes begin to kink at log E=1.60 for the calculational domain of 0 < y < 1. In this case, zonally symmetric (k=0) unstable modes emerge at log E=1.65. Therefore, as discussed by TI2006, it is confirmed that the dispersion curves of the unstable modes kink when the value of E approaches the critical value of E at which zonally symmetric (k=0) unstable modes emerge.
The critical value of E at which zonally symmetric unstable modes emerge is different from the value obtained by TI2006. It seems that a narrow calculational domain causes the difference of the critical value. For the calculational domain larger than -1 < y < 2, zonally symmetric unstable modes (inertially unstable modes) emerge at log E=1.20, as shown by Stevens (1983) and TI2006 (figures not shown). However, for narrower calculational domains, the critical value at which zonally symmetric unstable modes emerge deviates from log E=1.20.
 |
 |
 |
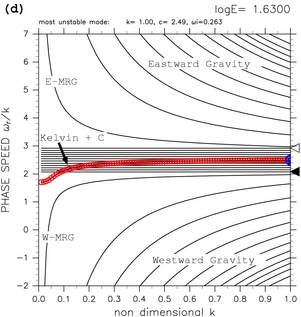 |
Figure 9: Dispersion curves for the calculational domain of 0.0 < y < 1.0. (a) log E=+1.10, (b) log E=+1.40, (c) log E=+1.60, and (d) log E=+1.63. The label "Kelvin + C" indicates dispersion curves of unstable modes caused by the resonance between equatorial Kelvin modes and continuous modes. Refer to table 1 for other symbols. See also animation of dispersion curves for 1.50 ≤ log E ≤ 2.50.