Figure 3-1 (left panel) shows the typical horizontal structure of continuous modes for log E=-0.20, 4.76 ≤ c ≤ 4.92. A blue filled circle in right panel indicates the position of the mode. In this case, only the structure of a continuous mode (C) appears.
The critical latitude of the mode shown in figure 3-1 is y=2.84. In the left panel of figure 3-1, an amplitude peak of geopotential of the mode appears near y=2.90. This represents a structure of a continuous mode.
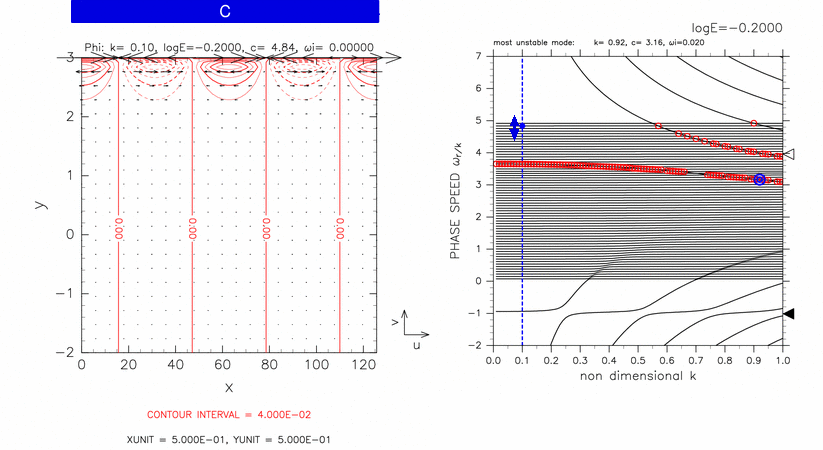
Figure 3-1: Horizontal structure of a continuous mode for log E=-0.20, k=0.10, c=4.84 (left panel). The position of the mode in dispersion curves is indicated by a blue filled circle in the right panel. Contours and vectors in the left panel indicate &phi and velocity field, respectively. Contour intervals are 4.00 × 10⁻². Other symbols in the right panel are same as table 1.