Please get the Flash Player to see this animation.
| Development of a Cloud Convection Model for Jupiter's Atmosphere | << Prev | Index| Next >> |
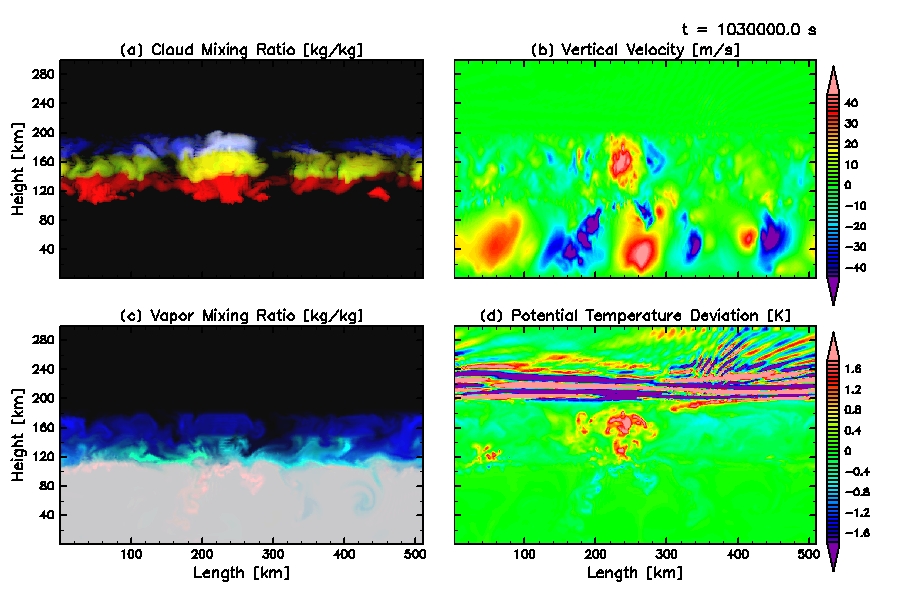
Fig. 3.2 shows distributions near the end of the calculation of cloud mixing ratio, vertical velocity, vapor mixing ratio, and potential temperature anomaly. Hereafter, for simplicity, cloud and rain will be treated collectively. For example, we will refer to the sum of mixing ratios of cloud and rain as the cloud mixing ratio.
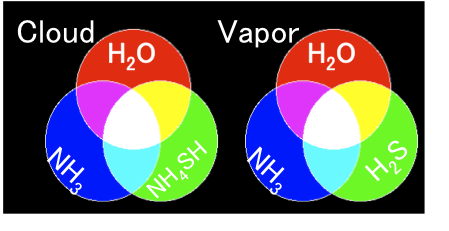
Fig. 3.2 (a) shows that there are many clouds that develop between the H2O condensation level (z ≈ 120 km) and the tropopause (z = 200 km). In regions of active convective motion, there are clouds represented by yellow indicating the mixture of H2O and NH4SH, and clouds represented by white indicating the mixture of all three components. This means that H2O cloud particles are advected upward to altitudes above the NH4SH reaction level (z ≈ 150 km) and the NH3 condensation level (z ≈ 180 km) and that NH4SH cloud particles are advected upward to altitude above the NH3 condensation level.
There is a sharp contrast in the distribution of vertical velocity between the regions above and below the H2O condensation level (Fig. 3.2b). The distribution of vertical velocity below the H2O condensation level is characterized by fairly steady upward and downward motions, whereas the air motion above the H2O condensation level is unsteady. The updrafts that occur above and below the H2O condensation level are not connected at the condensation level. The downdrafts are also disconnected at the H2O condensation level. In contrast, such discontinuity of convective motion is not found at the NH3 condensation level or the NH4SH production level. The strong updrafts that ascend from the H2O condensation level reach the tropopause, breaking through the NH3 condensation level and the NH4SH production level.
The distribution of vapor mixing ratio is also distinct for the regions above and below the H2O condensation level (Fig. 3.2c). Below the H2O condensation level, all of the three condensible volatiles are well mixed, as represented by fairly homogeneous gray color. Above the H2O condensation level, the mixing ratio of each volatiles is highly inhomogeneous. In some regions, extremely dry air containing little condensible volatiles, which is represented by the nearly black color, reaches down from the tropopause to the H2O condensation level, breaking through the NH3 condensation level and NH4SH production level.
We can summarize the characteristics shown in Fig. 3.2 (b, c) by saying that the H2O condensation level acts as a kinematic and compositional boundary, but neither the NH3 condensation level nor the NH4SH production level acts as a significant boundary. These results are contrary to our anticipation in Section 1 that the convective motion may also be disconnected at the levels of formation of NH3 and NH4SH clouds, but rather resemble the results of the previous study [6] that consider H2O condensation only.
The distribution of potential temperature anomaly from the horizontally averaged profile is shown by Fig. 3.2 (d). The regions where convective clouds develop are warmer than their surrounding environment. Potential temperature is almost homogeneous below the H2O condensation level, except for the cold plumes observed below the convective cloud, which result from evaporation of rain precipitating down from the clouds above.
Please get the Flash Player to see this animation.
|
Figure 3.2: Animation of simulated convection. Distributions of cloud mixing ratio (a), vertical velocity (b), vapor mixing ratio (c), and potential temperature anomaly (d) near the end of the calculation, respectively. Cloud mixing ratios are represented by logarithmic scale ranging from 1.0 × 10⁻⁸ -- 5.0 × 10⁻⁴ kg/kg. Vapor mixing ratios are represented by linear scale normalized by the initial values. The detail of the visualization technique of clouds and vapor is described in Section 2.3. (To view this animation, please turn on JavaScript and install Flash Player ver.9. To view this animation on your PC, please download arare.flv and use viewers such as vlc.) |
 |
| Development of a Cloud Convection Model for Jupiter's Atmosphere | << Prev | Index| Next >> |