F. Atmospheric Structure in the Runaway Greenhouse State |
a. Time Evolution of Global Mean Values
The thermal field and circulation structure of a runaway greenhouse atmosphere will be discussed below. The results from Experiment S1800 will be presented. It can be presumed that atmospheric conditions similar to those from Experiment S1800 will be achieved in Experiment S1600 and S1700 with the passage of sufficient time.
First, time evolutions of the global mean values are examined. Figure 1 shows time evolutions of global mean surface temperature and OLR. For a global mean solar irradiance of 450 W/m2, only approximately 330 W/m2 of OLR is emitted on the global average on Day 1000 (Figure 1). Therefore, the atmosphere cannot achieve an equilibrium state, resulting in an increasing surface temperature with time. On Day 1000, global mean surface temperature reaches 360 K (Figure 2). |
(a) 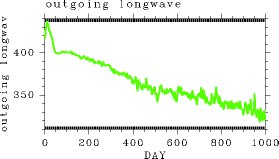 Figure 1: Time evolution of global mean OLR (W/m2) in Experiment S1800. (b) 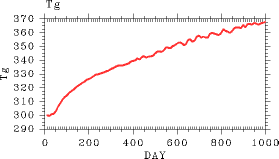 Figure 2: Time evolution of global mean surface temperature (K) in Experiment S1800. |
In a runaway greenhouse state, the water vapor content increases with increasing temperature. As an indicator of the water vapor content in the atmosphere, the time evolution of the latent heat energy is examined. Figure 3 illustrates the time evolution of global mean latent heat energy. The latent heat energy in the atmosphere increases monotonically with time, reaching a value of 6.0 × 10⁹ J/m2 on Day 1000. This value is larger by an order of magnitude than that in equilibrium states. As a result of the increased water vapor content, the total mass of the atmosphere also increases with time. Figure 4 shows the time evolution of global mean surface pressure. Surface pressure also increases monotonically with time, reaching a value of 1230 hPa on Day 1000. Due to the increasing water vapor content, the atmosphere becomes optically thick enough and the atmospheric layers which mainly emit radiation to space locate near τ = 1. Furthermore, because the atmospheric water vapor content is quite high around this height, the temperature structure around the height is determined by the saturated water vapor pressure curve. Therefore, the value of OLR is determined by the temperature structure that is determined by the saturated water vapor pressure curve, capping the value of OLR at 330 W/m2. |
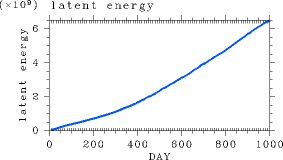
Figure 3: Time evolution of global mean latent heat energy (J/m2.) in Experiment S1800.
|
Figure 5 shows the time evolutions of global mean precipitation and evaporation. Evaporation increases monotonically during the first 500 days, but remains nearly constant after Day 500. Although precipitation increases initially with time as is the case for evaporation, fluctuations in precipitation also increase with time. This result can be probably explained by the fact that a large amount of precipitation occurred at the time of the emergence of instabilities while the amount of evaporation is determined almost entirely by the amount of insolation (most of the incident solar energy flux is converted into evaporative flux as will be described in Atmospheric Structure of the Runaway Greenhouse state: Meridional Thermal Structure). On Day 1000, the amount of precipitation is approximately 70% of the amount of evaporation, implying that the remaining 30% of the water evaporated into the atmosphere is stored in the atmosphere. |
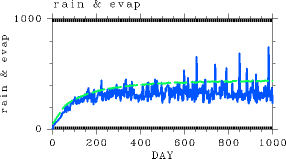 Figure 5:Time evolution of the global mean values of evaporation (W/m2) (green) and precipitation (W/m2) (blue) in Experiment S1800. |
Figure 6 shows global mean kinetic energy. Atmospheric kinetic energy decreases with time after a certain time. The figure suggests the weakening of atmospheric circulations in the runaway greenhouse state. |
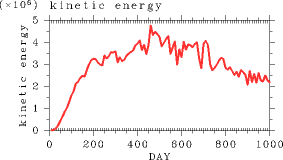
Figure 6: Time evolution of global mean kinetic energy (J/m2.) in Experiment S1800. |