|
3.d. Intensity of Convection (1)
|

|
|
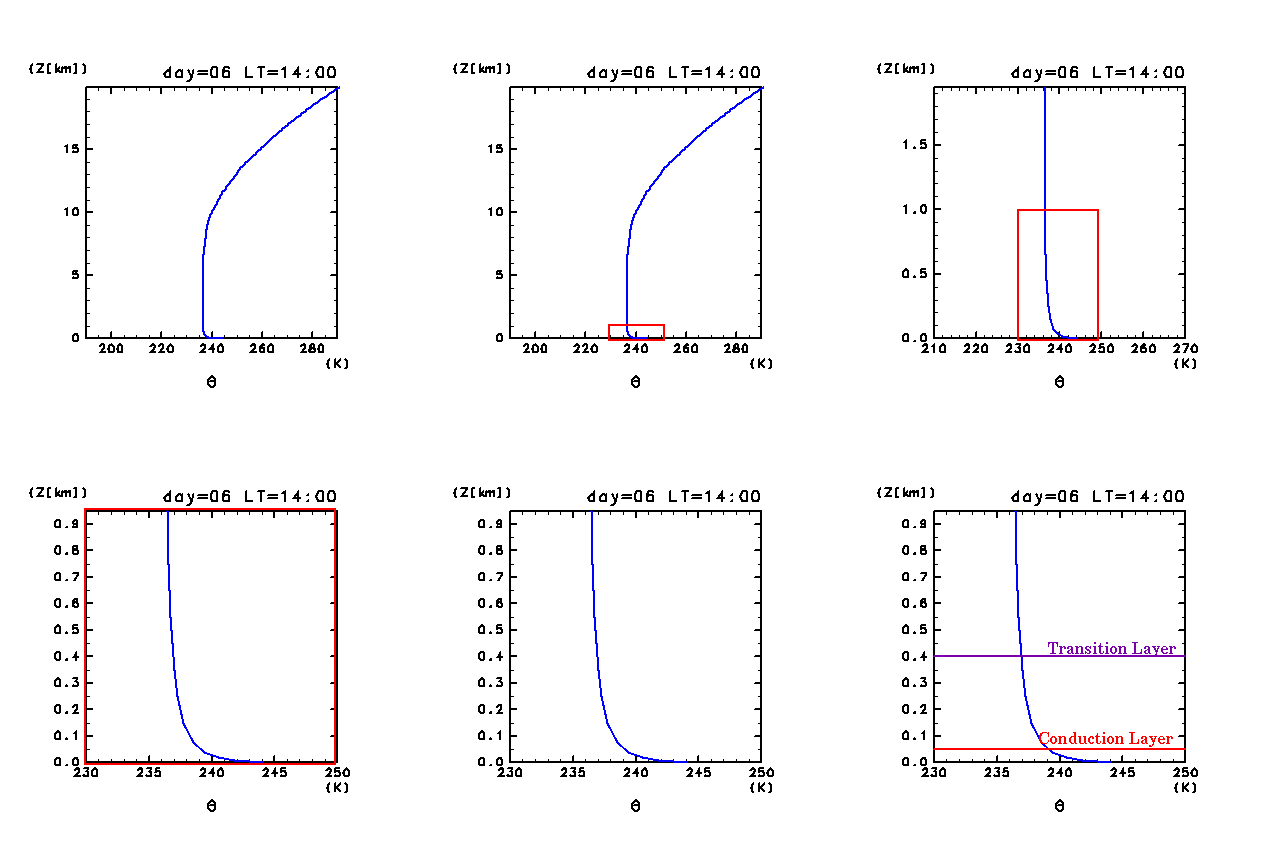
Figure 7: Vertical profile of horizontal mean potential
temperature below the height of 1 km at 14:00 LT for the dust-free
case.
|
As shown in Equation (1), wind
velocity associated with convection is given by convection layer
thickness and the temperature deviation of plumes. In this section, we
consider how the potential temperature deviation of convective plumes
can be estimated.
Referring to the features of convective plume generation, which can be
interpreted from Figure 4 (upper
left), it can be regarded that plumes are produced by thermal
instability of the thermal boundary layer. This suggests that
potential temperature deviation of a convective plume is roughly equal
to that of the thermal boundary
layer. Figure 7 is a magnified view of
Figure. 3a (right) of the plot for
potential temperature below 1 km. Careful observation of the profile
indicates that the thermal boundary layer can be further divided into
two regions according to the magnitude of the vertical gradient of
potential temperature. One such region is the layer below the 50 m
level, where the vertical gradient of potential temperature is quite
large (conduction layer), and the other
region is the layer between 50 m and approximately 400 m, where the
vertical gradient of potential temperature is relatively moderate
(transition layer).
|