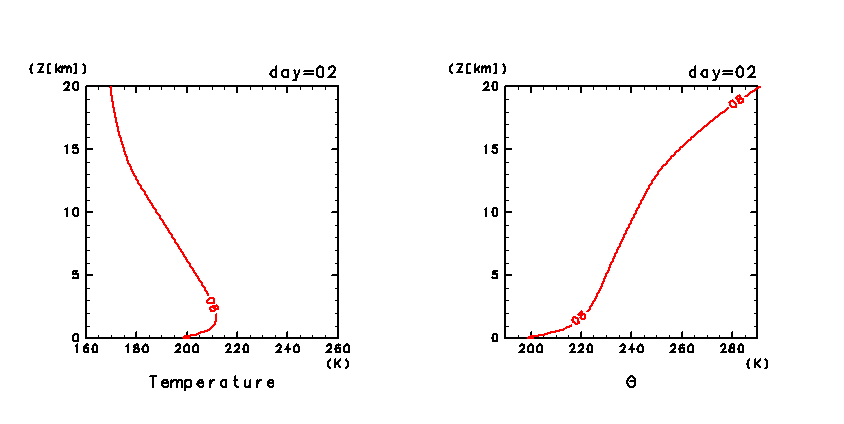
4.a.ii Horizontal mean temperature and potential temperature (for days 1 and 2 of the dusty case)
Figure 11c and Figure
11d show the development of vertical profiles of horizontal mean
temperature and potential temperature during the daytime for days 1
and 2 of the dusty case. The results of day 1 are similar to those of
the dust-free case (Figure 3a). On
day 2, horizontal mean potential temperature from 10 to 15 km becomes
vertically uniform after 13:00 LT. This indicates that vertical mixing
occurs at heights from 10 to 15 km. Vertical mixing is caused by the
vertical contrast of solar heating associated with dust (see
also Figure 11h).
Figure 11c: Vertical profiles of horizontal mean temperature
(left panel) and horizontal mean potential temperature (right panel)
plotted every 2 hours from 8:00 to 18:00 LT on day 1 of the dusty
case.
Figure 11d: Vertical profiles of horizontal mean temperature
(left panel) and horizontal potential temperature (right panel)
plotted every 2 hours from 8:00 to 18:00 LT on day 2 of the dusty
case.
A numerical simulation of thermal convection
in the Martian lower atmosphere with a two-dimensional anelastic model
Odaka, Nakajima, Ishiwatari, Hayashi,
Nagare Multimedia 2001