3. Results |
f. The Runaway Greenhouse State
In this section, the behavior of the atmosphere in the runaway greenhouse state will be summarized for the case of experiment S1800.
As previously stated, the atmosphere of a terrestrial planet cannot reach an equilibrium state when a runaway greenhouse state emerges. If such an event occurs, surface temperature will continue to increase, as will the water vapor content and atmospheric mass. Of water vapor that has been evaporated from the surface, approximately 70% will condense and thus contribute to atmospheric heating, while the remaining 30% will be retained within the atmosphere in the form of water vapor. For detailed descriptions on these changes, see Time Evolution of Global Mean Values and Time Evolution of Physical Variables.
The following are some characteristic features of the thermal and circulation structures of the atmosphere. (See Figure 1.)
- Meridional contrast is nearly eliminated.
Even for surface temperature distributions, the meridional contrast falls to 6.5 K.- The depth of the Hadley cell is increased.
The width of the Hadley cell is approximately 30 degrees, and is the same as that for the cases where the equilibrium state is reached.Condensation heat distribution, water vapor distribution, and zonal wind distribution are presented in the Meridional Structure in the Runaway Greenhouse State.
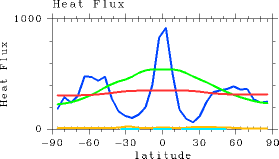
Figure 2 shows the meridional distribution of energy flux for experiment S1800. (See Meridional Thermal Structure for details on energy flux.) It can be seen that a large portion of the incident energy flux to the ground surface is transferred to the atmosphere in the form of evaporation energy flux. The precipitation distribution reveals the occurrence of significantly heavy precipitation at high latitudes. The condensation heating associated with the precipitation strongly contributes to the diminishing of the meridional temperature contrast. In response to the heavy precipitation occurring at high latitudes, the meridional heat transport and disturbance activities are also greatly enhanced in comparison to cases in which the equilibrium states are reached.
Figure 1: Meridional distributions of temperature (K) and mass stream function (Kg/sec) in the case of experiment S1800.

Figure 2: Meridional distributions of horizontal mean energy fluxes (W/m2) in the case of experiment S1800: condensation heating (blue), evaporation (green), OLR (red), net upward radiation from the surface (orange), surface latent heat (aqua).
Figures referred in this section are listed below. These are parts of Appendix F and provide details on atmospheric structures in the runaway greenhouse state.